Definition Your “Risk Level” is how much risk you are willing to accept to get a certain level of reward; riskier stocks are both the ones that can lose the most or gain the most over time. Risk Understanding the level of risk you need and want is a very important part of selecting a Read More…
HTMW Quote
Actually, one of the better indicators historically of how well the stock market will do is just a Gallup poll, when you ask Americans if you think it’s a good
. . . Nate Silver
A good way to evaluate a manager is to ask many relevant questions pertaining to your own personal financial situation and your financial goals. Examples of questions to ask are:
Small cap stock investing is volatile. That is one of first things you should know and understand. So, why risk your money by investing in what is typically considered risky business?
Learn the classic market cycles of accumulation, mark up, distribution and mark down so that you can time the market -consistently – and make steady profits any time.
In the world of stock analysis, fundamental and technical analysis are on completely opposite sides of the spectrum. Earnings, expenses, assets and liabilities are all important characteristics to fundamental analysts, whereas technical analysts could not care less about these numbers and only focus on price and volume.
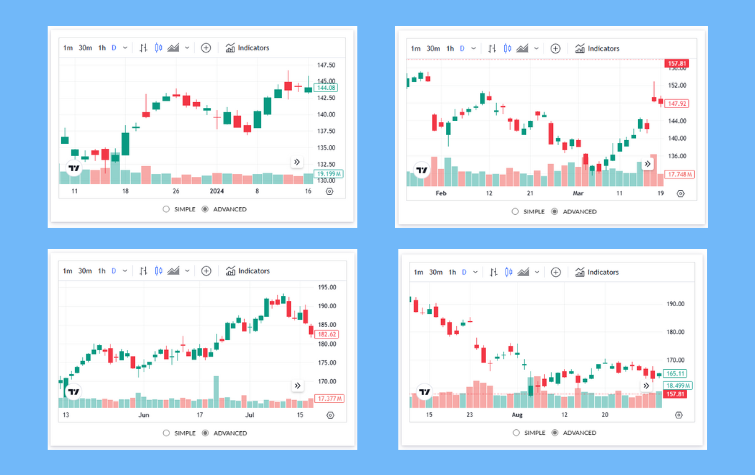
You do not need anything else on a stock chart but the candles themselves to be a successful swing trader! And, there is nothing that can improve your trading more than learning the art of reading candlestick charts
With ETFs, you can scaled down the size of the transaction for small investors.
A trailing stop loss is calculated in a manner like the way we calculated our initial stop loss. The only difference being that while we calculated our stop loss from the entry price, we’re calculating our trailing stop loss from the highest price since entry.
Stock market prices are affected by business fundamentals, company and world events, human psychology, and much more

Fundamental analysis is the process of looking at the basic or fundamental financial level of a business, especially sales, earnings, growth potential, assets, debt, management, products, and competition.
A Sharpe Ratio calculates the extra return you make compared to the extra risk you take on.