Is it worthwhile to use Robinhood for your investments instead of one of the many other investing apps out there? At HowTheMarketWorks, we provide our members with unbiased reviews of investing apps and tools. We do that by using the tools in question to make sure you’re getting the full picture before you try them Read More…
A short stock is an expression used when you sold shares of a company that you did not own beforehand. Let’s say you expect a stock’s price to drop. Shorting a stock would involve a strategy where you borrow shares from another party (usually a broker) and sell it on the market. Borrowing from a Read More…
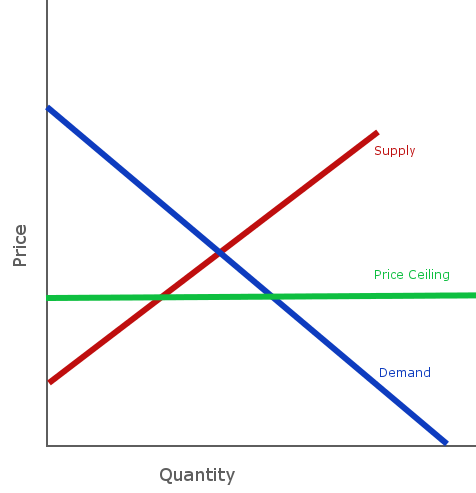
Definition “Price Controls” are artificial limits that are put on prices. If the limit is put in place to prevent prices from getting too high, they are called Ceilings. If they are in place to prevent the price from getting too low, they are called “Floors”. Price Ceilings Price Ceilings are controls put in place Read More…
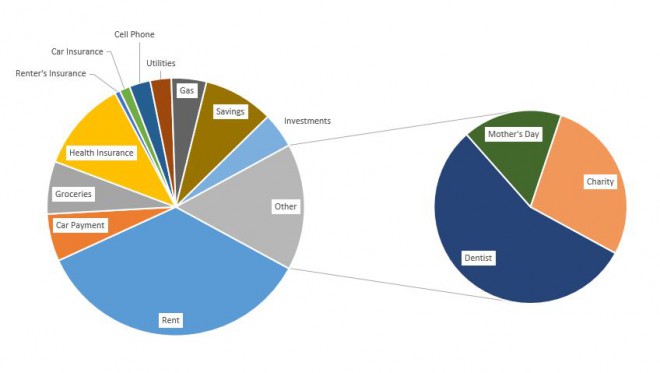
A “Spending Plan” is exactly as it says – a plan of what you will be spending each month. There are usually two parts – your “fixed” spending and your “variable” spending. The fixed part is usually the same every month, with things like rent/mortgage payments, grocery bills, insurance, and car payments. The variable part Read More…
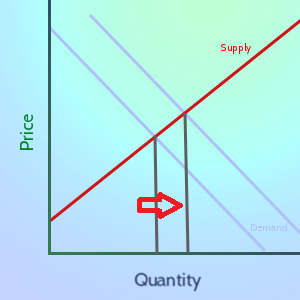
Definition In Economics, “Demand” is the relationship between prices and how much people want to buy a good or service. Details As the market price of a good goes up, the amount of that good that people are willing to pay generally goes down. This is because each person puts some value on the good – Read More…
Definition In Economics, “Supply” means the relationship between prices and production. In general, the higher the market price of a good or service is, the more producers are willing to sell of it. Details As the market price for a good goes up, companies want to sell more of it to try to make greater profits. Read More…
Definition The stock market crash of 1929 was a massive crash in stock prices on the New York Stock Exchange, and marks the largest financial crash in the United States. Details The stock market crash came in multiple parts – the initial crash on October 28 (a 12.87% drop) continued into October 29 (a 11.73% drop), Read More…
Definition The Reserve Requirement is how much of all deposits that a bank is required to keep “on hand”, meaning in its vaults, or on deposit at the Federal Reserve Bank (in the United States). Details The “Reserve Requirement” is about 10% of all money that has been deposited at a bank. Because of how Read More…
Definition: “OHLC” stands for “Open, High, Low, Close”, and this is a chart designed to help illustrate the movement of a stock’s price over time (typically a trading day, hour, or minute) OHLC are very useful for provide quick visual details, especially for technical analysis. Details on OHLC Charts OHLC charts are also known as Read More…
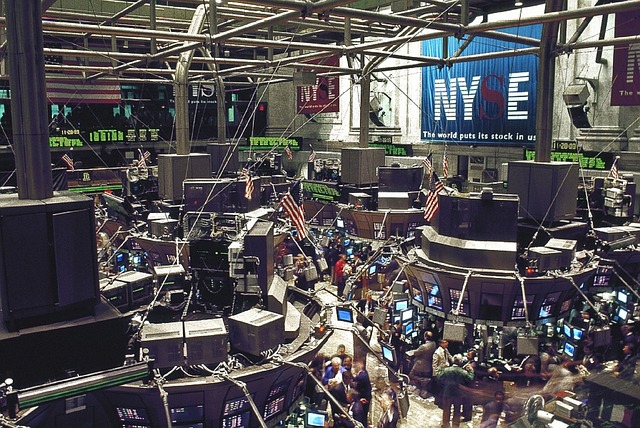
Definition The New York Stock Exchange (or NYSE) is the largest stock exchange in the world. Think of it as an organized, fast-paced flea market where buyers and sellers from all over the world come to trade U.S. stocks (and now some foreign shares as well). It is where over 2,800 of the biggest U.S. Read More…
Definition An order type that allows to set a moving stop or limit target price. The target price moves based on the daily high. Trailing stops can be set either in percentage or in dollars and cents terms. When in dollar terms it will activate when the price has moved by the target you have Read More…
Definition Your “Risk Level” is how much risk you are willing to accept to get a certain level of reward; riskier stocks are both the ones that can lose the most or gain the most over time. Risk Understanding the level of risk you need and want is a very important part of selecting a Read More…
Definition Open Interest is the total number of options or futures contracts that are “open”, meaning currently owned by an investor and not yet expired. Details Think first in terms of options contracts: by owning an option, it signifies that there is interest in actually trading that stock, although at a different price. Since this Read More…
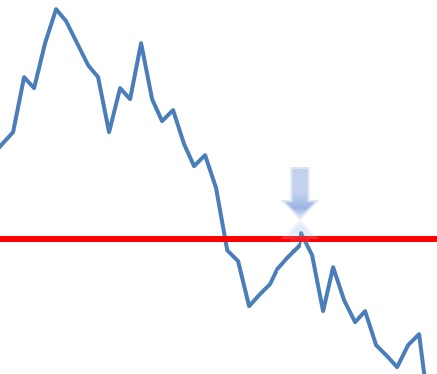
A pullback is a technical analysis term used frequently when a stock “pulls” back to a resistance and/or support line, usually after a breakout has occurred. Pullbacks can be in an uptrend or downtrend and can pull back upwards or downwards. In the example below we can see a pullback as it retraces back to Read More…
The S&P 500, or the Standard & Poor’s 500, is a stock market index based on the common stock prices of 500 top publicly traded American companies, as determined by S&P. It differs from other stock market indices like the Dow Jones Industrial Average and the Nasdaq Composite because it tracks a different number of stocks and weights the stocks differently. It is one of the most commonly followed indices and many consider it the best representation of the market and a bellwether for the U.S. economy.
Introduction The Sharpe Ratio is an important tool for evaluating a stock, or a portfolio, based on how risky it is to get a higher return. You can use the Sharpe Ratio to determine how consistent the returns of a stock or portfolio are, so you can determine if the returns are stemming more from Read More…
Over-The-Counter (OTC) Stocks Most investors are familiar with NASDAQ, the NYSE (New York Stock Exchange), TSX (Toronto Stock Exchange), and most other large national stock exchanges. However, there are also thousands of companies that want to sell shares to the general public, but are not able to sell on these exchanges. Stock traded on these Read More…
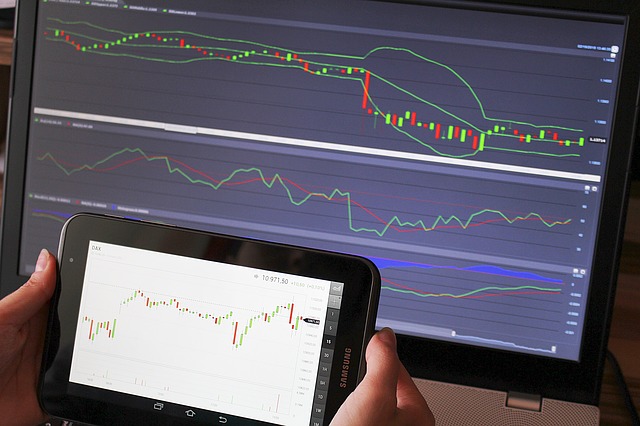
Technical analysis software automates the charting, analysis and reporting functions that support technical analysts in their review and prediction of financial markets (e.g. the stock market).
Price ceiling is a government-mandated limit on the price that can be charged for a given product, such as a utility or electricity. The intended purpose of a price ceiling is to protect the consumers from conditions that would make a vital product from being financially unattainable for consumers.
