Given two variables or more variables of interest, we can measure the degree and direction of their linear association using correlation analysis.
A correlation of 1 indicates a perfect linear relationship, while a correlation of -1 implies a perfectly negative linear relation. A value of 0 means there is no association at all.
Correlation analysis is used extensively in the fields of statistics, economics, accounting, and finance. Some practical applications include (but not limited to):
- Assessing the relationship between inflation, money supply, and stock returns
- Determining the impact of including different asset classes in our portfolio on return and risk
- Quantifying the benefits investing in foreign or emerging markets
- Analysing correlations between exchange rates
- Gauging the correlation between items on a company’s financial statements (e.g., the relationship between net income and cash flow
How Do We Measure Correlation
If we have a pair of data series for two independent variables, we can compute the correlation between using the following steps:
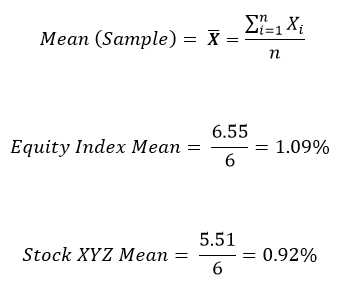
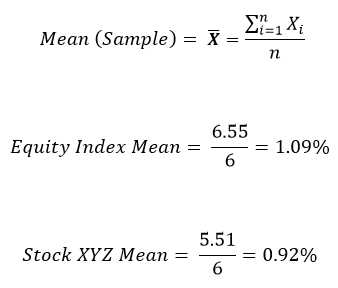
Step 1: Calculate the mean of each data series
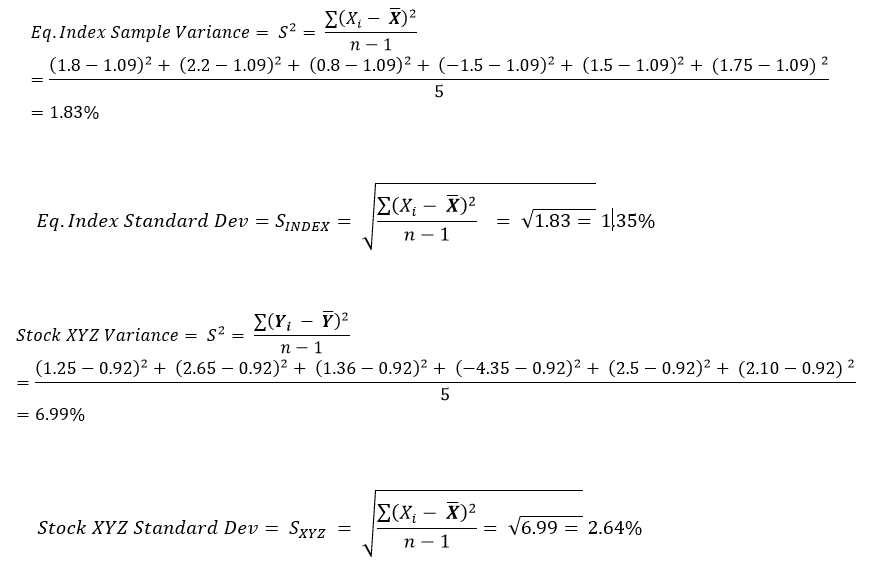
Step 2: Calculate variance and standard deviation for each variable
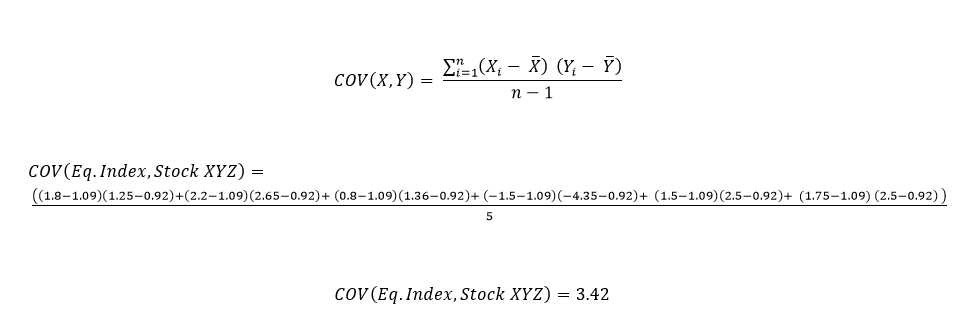
Step 3: Determine the data series’ covariance
Step 4: Calculate the correlation coefficient using the covariance and standard deviation results obtained
AN ILLUSTRATION:
Assume we have the following data series for 2 variables of interest: (1) An Equity Index (2) Stock XYZ. They represent each variable’s return (%) for a 6 month period. Sample size (n) = 6.
|
Equity Index (%) |
Stock XYZ (%) | |
| (%) | (%) | |
| Month 1 |
1.8 |
1.25 |
| Month 2 |
2.2 |
2.65 |
| Month 3 |
0.8 |
1.36 |
| Month 4 |
-1.5 |
-4.35 |
| Month 5 |
1.5 |
2.5 |
| Month 6 |
1.75 |
2.1 |
STEP 1: CALCULATE THE MEAN OR AVERAGE OF EACH DATA SERIES
STEP 2: CALCULATE VARIANCE AND STANDARD DEVIATION FOR EACH VARIABLE
Note: Since we are dealing with a sample, the denominator in the formula below is (n-1) rather than (n)
STEP 3: DETERMINE THE COVARIANCE BETWEEN THE TWO SERIES
STEP 4: CALCULATE THE CORRELATION COEFFICIENT
The correlation coefficient between the stock index and stock XYZ can be found by dividing the covariance by the product of the standard deviations of the index and stock XYZ. The formula is:
LIMITATIONS OF CORRELATION ANALYSIS
Interpretation of correlation results can be misleading in certain cases. Some of the limitations include:
- Certain functions or non-linear associations between independent variables could yield low correlation figures when in fact, the relationship between the variables exhibits a strong relationship. This disadvantage stems from the fact that correlation is a linear approximation of the association between variables
- Correlations can be highly sensitive to outliers that are present in the data of variables. For example, for a set of observations with outliers, excluding such anomalous data could make a significant impact on the correlation coefficient. Of course, this also introduces another challenge. Does it make sense to include such outliers or not? Perhaps they contain relevant information.
- Correlations could also suggest a relationship between variables, even when none actually exist. This could be attributed for example to mere luck. Another possible explanation is the interaction of the two variables with a third variable.
CONCLUSION
Correlation is a measure of the strength of linear association between 2 or more variables. The returns of two highly correlated stocks for example, tend to strongly move in the same direction.
The use of correlation analysis extends to numerous important fields. For example, in finance, correlation analysis can be used to measure the degree of linear relationships between interest rates and stock returns, money supply and inflation, stock and bond returns, and exchange rates.
Some of its short-comings include its unreliability, sensitivity to outliers, and the suggestion of linear relationships where none exist.
As such, its interpretation should be viewed cautiously as investment decisions made on biased correlation analysis can lead to (and it has) costly financial decisions.


