Definition: A ratio showing how much a company pays in dividends each year relative to its share price. Assuming that the stock price does not change, the dividend yield is the only return on the stock holder’s investment.
Dividend Yield
Example: Dividend yield is a way to measure how much “bang for your buck” you are getting from your investment through dividends.
To better explain dividend yield, lets explore an example. If two companies pay the same annual dividends of $1 per share per year, but XYZ company’s stock sells at $20 while ABC company’s stock sells at $40, then XYZ has a dividend yield of 5% while ABC is only yielding 2.5%. Assuming that all other factors are the same, an investor that is looking to add to his or her income would likely prefer XYZ’s stock over that of ABC’s stock.
Click Here to see all Beginner Stock Trading Articles
Definition: Payments made to shareholders by corporations. When a company earns profit, the company can use the money to either re-invest in the business (called retained earnings) or to give shareholders as dividends or share repurchase. Many corporations keep a portion of their profit and pay the remainder as a dividend.
Explanation: Corporations can pay dividends in the form of cash, stock or property. Most large profitable companies offer dividends to their stockholders. Their share prices might not move much, but the dividend they pay make up for this.
Higher-growth companies typically don’t offer dividends because their profits are reinvested to help continue their higher than average growth.
Preferred stock is a special class of stock issued by a company that pays dividends. Preferred stock is more like a bond than true stock because the main appeal is dividend income. Most are limited in the total profit they can earn. Some of these stocks can be tied to certain projects a company offers and can be less like traditional preferred stocks.
Further explanation of Preferred Stock:
There are certainly pros and cons when looking at preferred shares. Preferred shareholders have priority over common stockholders on earnings and assets in the event of liquidation and they have a fixed dividend (paid before common stockholders), but investors must weigh these positives against the negatives, including giving up their voting rights and less potential for appreciation. In general, these types of stocks can be a good balance between the pros and cons of bonds and common stocks.
Common stock is a form of corporate equity ownership, a type of security. The terms “voting share” or “ordinary share” are also used in other parts of the world. It is called “common” to distinguish it from preferred stock. It usually carries with it the right to vote on certain matters, such as electing the board of directors. However, a company can have both a “voting” and “non-voting” class of common stock.
Further Explanation of Common Stock:
If the company goes bankrupt, the common stockholders will not receive their money until the creditors and preferred shareholders have received their respective share of the leftover assets. This makes common stock riskier than debt or preferred shares. The upside to common shares is that they usually outperform bonds and preferred shares in the long run. However, unlike preferred stock the common equity also, in general, receives less dividends.
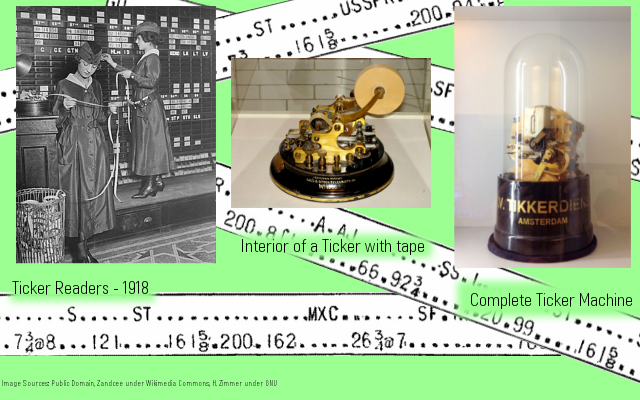
A ticker symbol is a unique one to five letter code used by the stock exchanges to identify a company. It is called a ticker symbol because the stock quotes used to be printed on a ticker tape machine that looked like the images below. When it printed the stock quotes, it made a tick-tick-tick sound!
Caution: When researching a company, don’t be tricked into thinking that the ticker symbol is just an abbreviation of the company name. Sometimes it is very different.
For example, here are some popular and interesting ticker symbols:
Ticker
Company
WMT
Walmart
AAPL
Apple
DOW
Dow Chemical
F
Ford
Ticker
Company
LUV
SouthWest Airlines
HOG
Harley Davidson
BUD
Anheuser-Busch
KO
Coca-Cola
How do companies pick their tickers?
It depends on who is in charge! Companies can choose whatever they want to be their ticker symbol, as long as it’s not already taken, and the regulators don’t think it’s misleading. In a famous case, a company was prevented from choosing FBI as their ticker.
Usually, companies pick a ticker thatcould be an abbreviation for their company to make it easier for investors to find. Other times, the connection is less obvious. In the examples above, we have:
LUV, for SouthWest Airlines. They chose this ticker symbol because their business started at Love Field, an airport in Texas.
HOG, for Harley Davidson. Motorcycle fans will often refer to Harley motorcycles as Hogs, which they borrowed for their ticker.
BUD, for Anheuser-Busch, is a brewing company, and one of their most popular beer brands is Budweiser, which they used for their ticker.
KO, for Coca-Cola. CO was already taken when Coca-Cola first became a public company, so they chose the next-best sounding ticker.
Companies will usually choose the shortest possible tickers, since longer tickers seem like newer, less-established companies.
Why do we use tickers?
You must have the stock’s ticker symbol in order to place your first trade! It is the only way to make sure you are buying the shares of the company you want. So please make sure you find the correct ticker symbol.
Most beginning investors find it confusing to use ticker symbols because before you can begin to do any stock research, you must look up the ticker. And when you do look up tickers, you will often be surprised how many companies there are that have very similar names. Make sure you are buying the stock that you think you are buying. Ticker “COKE” is not the Coca-Cola Company! Wouldn’t it just be easier if we used the company names? HowTheMarketWorks tries to help this with our Smart Trade Drop-Down, where by typing the company name in the trading window, we will give you tickers that match. Click here to try! However, lets take a look at where ticker symbols came from, and why we still use them today.
Early Tickers
Ticker machines first came into use during the late 1800s as a fast way to move news across far distances; they used telegraph lines to transmit messages electronically. However, with a telegraph machine, each letter of the message had to be spelled out in Morse Code (a series of dots and dashes), read by the operator on the other end, and then typed out onto a message to be actually read by anyone.
This was a time-consuming process; the longer the message, the longer it took to write, translate, and read. To speed things up, shorthand writing (the predecessor of today’s “text speak”) was invented. Famously, an old British admiral was the first person to use “OMG” as shorthand in a message to one of his colleagues.
For investors looking to get the latest stock prices, this was also a problem. Since there were hundreds of companies being traded and prices being updated every minute, the longer it took to communicate a company’s price meant the whole stream of information was held up. Thus, company names were shortened down to 1-5 characters, and the first ticker symbols were born.
Rise of Electronic Trading
Today, the original reason for tickers is still important; computers still take time to process longer names, so shorter codes can be a lot faster when executing billions of trades per day. If you are making trades as fast as you could, it would take almost 5x longer to write The Coca-Cola Company than it would be to write KO. It saves time and helps to distinguish between companies that have very similar names.
Other Ticker Symbol Information
Sometimes you might see a “.A” or “.B” after a ticker symbol. This usually indicates a class A or class B type of shares. Sometimes you might see a ticker ending with a “Q” this means the company has filed for bankruptcy. Sometimes you might see a “Z” added to the ticker, this means that there is a special situation occurring with the stock.
How to Find a Stock’s Ticker Symbol
On most financial websites, you will find a Quotes or Get Quotes link. When you click on those links, it will take you to a stock quote screen. Usually there is a link on that page that says Ticker Symbol Lookup or similar. If there is not a ticker symbol lookup link, then try just typing the company name in and some pages will show you related tickers.
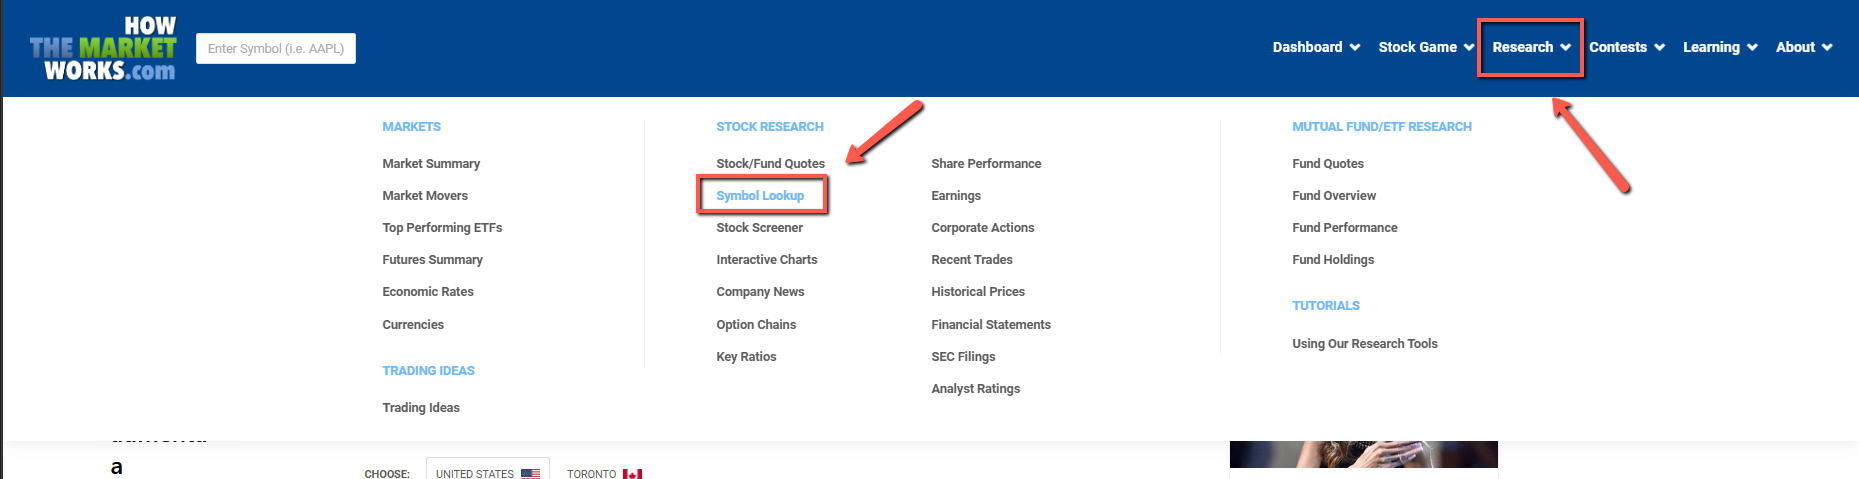
You can look up any ticker by going to the Research tab on the main menu, and clicking Symbol Lookup.
Definition: By law, every year, mutual funds must distribute that year’s net investment income (the total of dividends and interest received, less fund expenses) and net realized gain (gains less losses on securities sales) to its shareholders. These distributions are taxable income reported to the IRS on Form 1099. Investors must report the income on their tax returns. This poses a problem for some mutual fund investors who make initial purchases of mutual funds near the end of a calendar year. Because they receive a capital gains distribution, they immediately receive taxable income and face a mutual fund NAV that is reduced from the distribution.
Definition: Profit or loss resulting from the sale of certain assets classified under the federal income tax legislation as capital assets. This includes stocks and other investments such as investment property.
Example: Long-term capital gains are usually taxed at a lower rate than regular income. This is done to encourage entrepreneurship and investment in the economy. For example, if you own your home for more than one year, if you had bought your home for $200,000 and sell the home for $$225,000, then you have a capital gain of $25,000. There is a move by many in government to increase capital gains taxes as they see this lower rate as unfair???
Definition: A Call Option gives the holder the right, but not the obligation to purchase one hundred (100) shares of a particular stock at a specific price by a specified date. Call Options are bought by investors who anticipate a price increase.
Example: Options are derivative instruments, which means that their prices are derived from the price an underlyiny security or stock. Normally, options values are determined from the price of an underlying stock, the difference between the current stock price and the option’s strike price, and the amount of time left until the option expires. Let’s assume you bought a call option on shares of Intel (INTC) with a strike price of $40 and an expiration date of April 16th. With this option you would have the right to purchase 100 shares of Intel at a price of $40 on or before April 16th. The right time to do this will only be beneficial if Intel is trades above $40 per share at that particular point in time. Take notice that the expiration date consistently lands on the third Friday of each month when the option is scheduled to expire. (Note-recently the exchanges started issues weekly expiration options on the high volume stocks.)
Each call option corresponds to a contract between the buyer and the seller. The call option buyer has the right to buy the stock at the strike price, and the seller has the obligation to sell the stock at the strike price if the buyer chooses to exercise his option. When an option expires and it is not in the buyer’s best interest to exercise the option, then they are not obligated to take action.
As a quick example of how call options make money, let’s say IBM stock is currently trading at $100 per share. Now consider that an investor purchased one call option contract on IBM with a $100 strike and at $2.00 per contract. Because each options contract is for 100 shares of stock, the real cost of this option will be $200 (100 shares x $2.00 = $200). Take a look at will happen to the value of this call option under an assortment of several scenarios.
Suppose when the option expires, IBM will trade at $105. Keep in mind that the call option will give the buyer the ability to purchase shares of IBM at $100 per share. In this example the buyer can use the option to buy these shares at $100, then instantly sell those exact shares in the open market for $105. This option is therefore called in the money. As a result, the option will sell for $5.00 on the closing date, because each option represents an interest in 100 underlying shares, this will amount to a total sale price of $500. Because the investor bought this option for $200, the net profit to the buyer from this transaction will be $300.
When this option expires, IBM is trading at $101. Utilizing the identical analysis indicated above, the call option now has a value of $1 (or $100 total). Because the investor used up $200 to buy the option, the investor will display a net loss on this trade of $1.00 (or $100 total). This option will be called at the money since the transaction is basically a wash.
When the option expires, IBM is trading at or below $100. So if IBM ends up at or below $100 on the option’s close date, then the contract will expire out of the money. It’s now, so the option buyer will lose 100% of their money (in this case, the full $200 that the investor spent for the option).
For further information about trading call options visit this site.
Definition: Stocks of leading and nationally known companies that offer a record of continuous dividend payments and other strong investment qualities.
Example: The name “blue chip” came about because in the game of poker the blue chips have the highest value. Blue chip stocks are seen as a less volatile investment than owning shares in companies without blue chip status because blue chips have an institutional status in the economy. Investors may buy blue chip companies to provide steady growth in their portfolios. The stock price of a blue chip usually closely follows the S&P 500. Here is a partial list of Blue Chip Stocks:
Wal-Mart Stores
Exxon Mobil
Chevron
ConocoPhillips
Fannie Mae
General Electric
Berkshire Hathaway
General Motors
Bank of America
Ford Motor
Definition: Trades greater than or equal to 10,000 shares in size and greater than or equal to $100,000 in value. The exact definition varies, but usually is 20,000 shares, 50,000 shares or 100,000 shares.
Example: 10,000 shares of stock (not including penny stocks) or $200,000 worth of bonds would be considered a block trade. However, in practice block trades are typically much larger as large hedge funds and institutional investors buy and sell huge sums of dollars and shares in block trades via investment banks and other intermediaries virtually on a daily basis.
Beta measures a stock’s volatility versus the market’s volatility. A stock’s volatility is calculated by comparing its return verses that of the overall market return. If a stock’s price does not move in the same direction as the market, it has a beta of zero. A beta above zero means that the stock follows the market. A Beta of 1 means that the stock follows the market very closely If a stock has a negative Beta, then its price moves the opposite direction of the market. The closer a stock is to a negative 1, the more the stock moves the opposite direction of the market.
Example Beta:
If a stock has a Beta of 2.0, it is twice as volatile as the market. If the S&P 500 fell by -10% in a given month, then the stock would be expected to fall around -20%. The stock would also be expected to gain more than the general market during an up market.
Click Here to see all Advanced Stock Trading Articles
Definition: The tendency of the stock market to trend higher over time. It can be used to describe either the market as a whole or specific sectors and securities. The opposite of a Bull Market is a Bear Market when the market is moving lower over time.
Example: Market trends are classified as secular for long time frames, primary for medium time frames, and secondary for short time frames. Traders identify market trends using technical analysis, a framework which characterizes market trends as predictable price tendencies within the market when price reaches support and resistance levels, varying over time.
Definition: A long period where the stock market value falls along with a sense of pessimism for the public. If the length of the declining stock prices isg stock prices is short and quickly turns into a period of rising stock prices, it is then called a correction. Bear markets are usually seen when the economy is in a recession and there is high unemployment or when there is rising inflation. The Great Depression of the 1930s is the most famous bear market in US history. Bull markets are the opposite and represent a strong rise in stock prices over a long period.
Example: The best recent example of a bear market was the one we saw between the end of October 2007 and March 2009. The market declined of 20% by mid-2008 was also seen in other stock markets across the globe. On September 29, 2008, the DJIA had a record breaking drop of 777.68. The DJIA reached a market low of 6,443.27 on March 6, 2009. This was a decline of over 54% since the October 9, 2007 high. A bull market then started on March 9, 2009, as the DJIA regained more than 20% from its low to 7924.56 with three weeks of gains. By the end of the year it had gained over 60%.
At-The-Money refers to an option whose strike price equals the price of the underlying equity, index or commodity.
Example of At-the-money :
If Pepsi stock is trading at $75, then the Pepsi $75 call option is at the money, and so is the Pepsi $75 put option. When the strike price and stock price are the same the option has no intrinsic value (since the strike and the underlying prices are the same). It will have time value (the stocks price may move in a favorable direction from now until the option expiry). The options that are at the money tend to be more active than when it is not at the money. These options are also referred to as ATM options (At The Money).
Definition:
The simultaneous purchase of a security on one stock market and the sale of the same security on another stock market at prices which yield a profit.
In Depth Description:
In economics and finance, arbitrage is the practice of taking advantage of a price difference between two or more markets: striking a combination of matching deals that capitalize upon the imbalance, the profit being the difference between the market prices. When used by academics, an arbitrage is a transaction that involves no negative cash flow at any probabilistic or temporal state and a positive cash flow in at least one state; in simple terms, it is the possibility of a risk-free profit at zero cost.
In principle and in academic use, an arbitrage is risk-free; in common use, as in statistical arbitrage, it may refer to expected profit, though losses may occur, and in practice, there are always risks in arbitrage, some minor (such as fluctuation of prices decreasing profit margins), some major (such as devaluation of a currency or derivative). In academic use, an arbitrage involves taking advantage of differences in price of a single asset or identical cash-flows; in common use, it is also used to refer to differences between similar assets (relative value or convergence trades), as in merger arbitrage.
People who engage in arbitrage are called arbitrageurs — such as a bank or brokerage firm. The term is mainly applied to trading in financial instruments, such as bonds, stocks, derivatives, commodities and currencies.
Definition: An order type that only executes when the full amount of the shares in the order can be executed, otherwise the order doesn’t execute at all. In other words, this order type guarantees there are no partial fills.
Example: If you place a Market Buy order for 100 shares of Google (GOOG) and there are only 75 available at the time the order is placed, then the order would not be executed. The order would wait until there were 100 shares available to purchase and then execute at that price.
SIMPLE DEFINITION: Technical Analysis is the use of technical indicator to predict which direction the stock price will move in the future. Technical indicators use past stock prices to calculate their value. COMPLETE DEFINITION: Technical analysis evolved from analyzing 100s of years of stock data. The theories for technical analysis began in Joseph de la Vega’s accounts of the Dutch markets in the 17th century. In the 1920s and 1930s Richard W. Schabacker wrote books continuing the work of Charles Dow and William Peter Hamilton from their books Stock Market Theory and Practice and Technical Market Analysis. In 1948 Robert D. Edwards and John Magee published Technical Analysis of Stock Trends. This book is considered to be the break through works of the discipline.
Technical Analysis dates back hundreds of years ago. According to historical records, a great Japanese rice trader by the name of Homma Munehisa (1724-1803) fathered candlestick charting and at today’s value, would have made over $100 billion in profits. He was considered the greatest trader in the history of the financial markets. This type of charting will be covered in subsequent articles (candlestick charting will be used in all articles). Therefore, technical analysis emerged from Japan. In the U.S., technical analysis first started to gain some following due to Charles Dow’s Dow Theory in the late 19th century. Charles Dow formed 6 principles that formed the foundation of technical analysis:
Three-moving Parts – The market has a primary movement, a secondary reaction, and a minor swing movement. The primary movement is the long-term trend that lasts for years, the secondary reaction is the retrace from the primary movement (typically lasting for months), and the minor swings are the much shorter swings that occur within a chart (usually neutral and lasting from hours up to a month).
Three-Phase Trends – The market is composed of three phases: an accumulation phase, public/media phase, and a distribution/selling phase. The “smart money” (sophisticated professionals) as the ones who are purchasing shares in Phase 1. In Phase 2, the media starts to focus on the particular stock or sector and the public (retail traders/investors) jump in. These are the momentum traders/investors that see a trend forming and want to get in on the action. In Phase 3, the “smart money” actually sells while the retail traders/investors keep buying.
Discounting Mechanism – The market discounts all news. This means that news that comes out is already factored in, or “priced” in. Obviously, this does not include illegal inside information.
Major Average Confirmation – This means that one industry that is dependent on another cannot rally unless both are rallying. This is especially true if the entire market is rallying but several key sectors are declining. In the chart below, you can see that the homebuilders (orange line) declined long before the market declined. The banking sector (sky blue) declined soon after. The financial sector used to be the #1 sector in terms of capitalization (banks were doing very well at the time!). Real estate and its related industries account for at least 25% of the U.S.’s GDP. With these two major powerhouse sectors declining, the market didn’t stand a chance.
Volume Confirms Action – Volume is extremely important. For a trend to continue, volume must increase. This represents added interest and additional buying which is required for a trend to propel itself to new highs. If a rally continues on lower volume, the trend cannot sustain itself and will fail. Let’s take a look at the rallies we had in 2008 as an example. Notice how the rallies were made on low volume and on the declines, we saw increasing volume. A healthy, strong market would exhibit the complete opposite.
Trends Continue Until They End – This is self-explanatory. An up trend continues until it ends and a downtrend continues until it ends. Typically, a trend ends when a lower high (for an up trend) or a higher low (for a downtrend) is achieved.
Now that we covered the basic history and foundation of technical analysis, let’s move on to its purposes and uses. It’s not designed to be a crystal ball! Patterns can and will fail and you will occasionally take losses. However, if you focus on highly reliable patterns, combine indicators, and perfect your entry and exit points, you’ll be way ahead of the game.
Entry & Exit Points – Technical analysis gives traders and investors advanced warning of when a trend changes against their favor. If you know how to recognize certain chart patterns and use price-volume divergences to your advantage, you’ll join the ranks of the “smart money” that accumulate long before everyone else jumps in. You’ll also be able to identify reversals, sometimes on the very same day and know when to exit a position.
Low-Risk Trading – The chances of putting on a successful trade is greater if you use technical analysis.
Know When to Sell Short – Technical analysis is not only used for “going long” (buying stock). 9 out of 10 investors/traders do not know how to sell stocks short, or are afraid to do so.
Use Candles to “Light the Path” – Candlestick charting, will help you see warnings in advance and give you enough time to react.
Identify and Trade Gaps and News – There are four main types of gaps: area, continuation, breakaway, and exhaustion gaps. Can you tell the difference? Gaps are usually formed on news, such as earnings or FDA approvals, etc.
Identify Potential Support & Resistance Areas – Trend lines are a part of basic chart reading.
Combine Indicators to Support Trading Decisions – There are dozens of indicators that are available to make trading decisions. You may have heard of the MACD, RSI, Stochastics, Money Flow, and many others. Or, perhaps you didn’t.
Definition: Trailing Stop is a Stop Loss order which is placed as a percentage value as opposed to an absolute dollar value. The order will only execute if the price of the security falls by a certain percentage. The trailing stop adjusts automatically as the price of the security rises and bases itself on the new appreciated value. This type of order allows profits to be made while cutting losses simultaneously.
Explation: This is such a useful tool, yet many fail to use it. Using a trailing stop allows you to let profits run while cutting losses at the same time.
Margin buying is buying securities/stocks with money borrowed from a broker. Since this money is borrowed, you can multiply profits or losses made on the securities. The stocks/securities are used as collateral for the loan.
Margin Explanation:
The broker will have a set minimum margin requirement (or initial margin) which is the maximum percent of the investment that can be paid for with borrowed money. A Margin Call is when the value of your investment drops your equity in the investment below the requirements of the broker at which time you have to add more money to your account or sell the security. Initial requirements as well as maintenance requirements are set by various governing bodies including the federal reserve.
Example:
Let’s say you want to short a stock. Unlike buying a stock, your losses are nearly limitless. When you buy a stock the most you can lose is the money you investing, so if you buy a 10$ stock you can lose at most 10$. If you short a stock at 10$ and the stock price goes to 100$ you will end up losing 90$!. That is the purpose of margin, not only to provide leverage but to ensure that you do not lose large sums of money and then default on your broker.
Note:Our system does not use margin so be careful when shorting.