Good Till Date Order Terms

If you have ever placed a limit or stop order on HowTheMarketWorks, you have see the “Good Till Day” order term on the trading menu:

A “Good-Till-Day” order is simply one that will cancel at the end of the trading day if it does not fill. So, for example, if you have Apple stock, and today you know they are releasing an Earnings Release, you know their price is probably going to change quite a bit today.

If you are worried about losing value, but don’t want to stare at the ticker all day, you can put a Sell Stop order at the price you would want to dump it at if the price starts falling, and set the order to cancel at the end of today.

If the price does start falling, the order will execute as soon as it hits your price threshold. If the price doesn’t fall, the order will cancel at the end of the day.

If you place a Good Till Day order after the market has closed, it will stay open until the end of the next trading day.

Why Use It?

Many people use Good Till Cancel orders, will will stay open until either they execute, or they cancel the order manually. One disadvantage to this is that you cannot execute a Market Order on stock you have an outstanding Limit Order on; this means that if you have a Stop order placed on your Apple stock, but the price goes up and you want to sell it, you would first have to cancel your Stop order before you can make a Sell market order.

Generally, people put Good Till Day orders on many Limit Orders for stocks they are hoping have a big spike during the day, and stop orders when they fear some market news may come out that will cause a long-term decrease in a stocks price.

Click Here to try it out!

How do I diversify my portfolio?

When it comes to investing, if you want to achieve long-term success you need to diversify your portfolio. Portfolio diversification is the process of spreading your investments across different asset classes, such as stocks, bonds, or real estate, as well as across different sectors or market capitalizations, to reduce risk and increase potential returns. When you diversify your portfolio, you create a more stable and resilient investing strategy that can handle market fluctuations, business or economic cycle changes, or other potential risks.

So, how do I diversify a portfolio?

This is a question every investor needs to ask themselves. With so many options available, it can be overwhelming to know where to start. Should you invest in index funds or individual stocks? Should you allocate a larger portion of your portfolio to real estate or digital assets? And how do you balance your investments to suit your individual risk tolerance and time horizon?

By taking a step-by-step approach to building a diversified portfolio, you can reduce your exposure to market volatility, and increase your chances of achieving your financial goals.

In this article, we’ll explain how to diversify your portfolio, including the benefits of diversification, how to identify the right asset classes for your portfolio, and advanced strategies for taking your portfolio to the next level. Whether you’re a seasoned investor or just starting out, this article will provide you with the framework you need to create a diversified portfolio that’s tailored to your needs and goals.

Portfolio Diversification

The Benefits of Diversification

There are a few major benefits of diversification. Investors diversify their investments because it helps to reduce risk, and either increases or stabilizes their returns. It also improves the long-term performance of their portfolio.
People invest in the stock market because they want to make more money than they could make by leaving it in the bank. Investors especially do not want to lose money. Capital Preservation is the idea that you want to preserve the money you have invested. Investors never want to be in a position where it would have been better to not have invested at all. So, to make sure that investors are protected from price swings, and to help simplify managing their portfolio, investors try to maintain a fully diversified portfolio.

Reduced Risk

One of the most significant advantages of diversification is its ability to reduce risk. When you invest in a single asset class, such as stocks or bonds, you’re exposed to the potential for significant losses if the market declines. If one asset class experiences a decline, the others can help offset the loss, reducing the overall risk of your portfolio. The same is true if you invest in multiple companies in the same sector or across different industries. It’s very unlikely that all companies in all sectors or industries will be equally impacted by changes in the financial markets.

Increased Potential Returns

Diversification can also help you achieve higher potential returns. This can help you achieve a higher overall return on your investments, as the returns from each investment can complement each other. In other words, the more stocks you own the more likely you are to own a stock that ends up doubling or tripling in price. For example, if you own an equal dollar amount of 10 different stocks and 9 of them stayed at the same price and one of them doubled, your portfolio would be up 10%.

Increased potential returns

However, a portfolio that consisted solely of stocks may experience significant growth over the long term, but it may also be subject to significant volatility. By adding bonds or other fixed-income investments to your portfolio, you can reduce the overall volatility and increase the potential for steady returns.

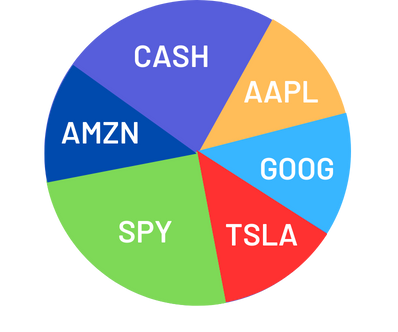
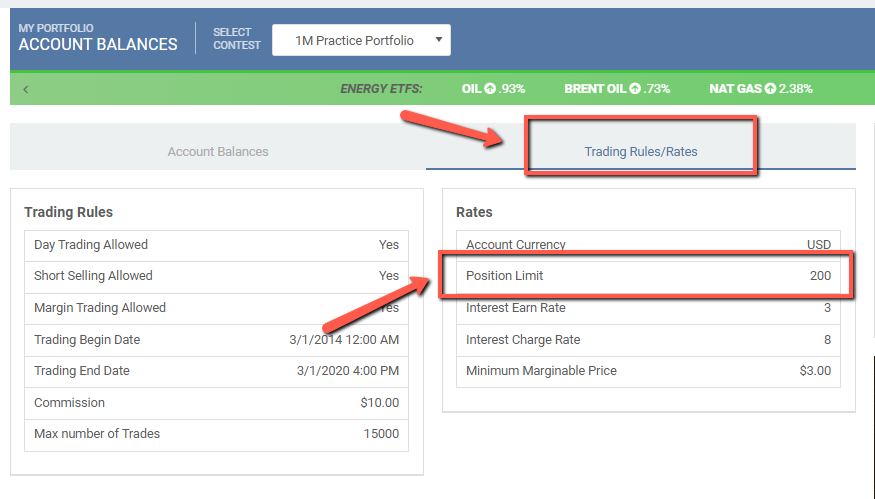
When you diversify your portfolio, you make sure that you never have “too many eggs in one basket.” If one of the stocks you have invested in starts to go down in price, you have limited your exposure to that stock by only having a smaller percentage of all your assets in that stock. For beginners, this can mean having no more than 20% of your portfolio in any one stock, ETF, or mutual fund. With real money, as you invest more money into your portfolio and as your portfolio grows in value, you should keep buying different stocks so that eventually you have less than 10% of your money in any one stock.

Diversification means that, for example, if you are investing in stocks in the Banking, Energy, Healthcare, Manufacturing, Luxury and IT industries, you would try to spread your money as evenly as possible across these industries. This way, if the Energy sector as a whole starts to have problems (for example, if the price of oil falls quickly), you don’t have to worry about your entire portfolio, and you have limited the losses you are exposed to from a single market shock.

Types of Diversification

There are 2 main types of diversification to think about as you first start investing.

1. Sector Diversification

With sector diversification you invest in different sectors of the economy, such as technology, energy, or manufacturing, to reduce the risk associated with a single sector. To diversify by sector means that you would split your investments across companies based on the type of business they do; energy companies would be oil producers, electricity companies, and companies that specialize in transporting materials needed for energy production. Manufacturing companies are firms that build everything from toys to cars to equipment to airplanes.

Sector diversification
Image by Jonathan from Pixabay

The idea behind sector diversification is if some larger trend negatively affects an entire industry, you want to protect the rest of your investments from being affected. For example, low oil prices caused a general decline in energy stocks (of course, with some companies still growing, and others hit especially hard). If you were holding shares in banking companies, these investments would not have been directly affected by this change.

Sector diversification

If you’re looking for a good way to find stocks in different sectors, Click Here to see how to research stocks by sector.

2. Stock Diversification

This is the basis of a well diversified portfolio, where you spread your money across several companies, instead of investing all your money in one stock or company. For example, if you want to put 10% of your money in the banking sector, that doesn’t mean you should put 10% of your money in Bank of America. You should have a few bank stocks in case one of your bank stocks is poorly managed and goes bankrupt. Individual stocks are more volatile than sectors, and sectors are more volatile than entire security types, so this is the core of all diversification.

Stock diversification
Image by Puneet Kumar from Pixabay

Other Types of Diversification

Geographic diversification

Geographic Diversification: where you invest in multiple countries or regions, exposing yourself to new risks like political instability, or currency exchange risk. However, you also can benefit from the higher potential growth in emerging markets or developing countries.

Size diversification
Image by Sergey from Pixabay

Size Diversification: is based on the size of the company, so you would invest in large-cap and small-cap companies to manage the risks of high-growth startups, versus the slower and more steady returns of larger established companies.

Time diversification

Time Diversification: involves separating your investments across different time horizons, so you have some short-term focused assets and some long-term securities so you can have positive future results as well as short-term gains.

Identifying Asset Classes

Each asset class has its own unique characteristics, risks, and potential returns, and by understanding these differences, you can make informed decisions about where to allocate your investments. Each asset class behaves differently in different market conditions. For example, during times of…

  • Economic growth: stocks tend to perform well, while bonds may experience lower returns.
  • Economic uncertainty: bonds may perform better, while stocks may decline in value.
  • Inflation: commodities such as gold or oil may appreciate, while bonds may decline in value.

We cover asset classes in more depth in the article, Basic Investing Strategies, however here is a short explanation for some of the main asset classes.

Stocks

When you invest in stocks you buy shares, or a percentage of ownership, in a company. Stocks have shown to be a great way to grow your wealth over the long-term, as you can earn money from capital gains or dividends. However, the stock market is also very volatile, so prices will fluctuate in the short-term and are considered a higher-risk investment.

Check out this Intro to Stocks article to understand the history and different types of stock. If you need some help picking stocks, check out this article on How to Pick Stocks.  

Bonds

When you invest in bonds you are buying a debt security, like an “I owe you” where you lend money to either a company (corporate bonds) or the government (treasury bills or T-notes). The borrower agrees to pay you back at a specific time in the future with interest.

Bonds are considered lower-risk than stocks since they have a fixed rate of return. However, the value of a bond is heavily affected by changes in interest rates. In recent years, the bond markets are experiencing a lot of volatility thanks to high inflation and rapid changes in interest rates.

Check out this Forbes article, The Bond Market Crash – And What One Can Do About It Now to learn more.

Real Estate

Real Estate

Any physical property, be it residential homes, commercial properties or agricultural land would be considered a real estate investment. You can earn money from the appreciation in value or from rental income. Investing in real estate is a great way to diversify your portfolio, however it’s more difficult to get access to your money or turn it into cash. Since it is less liquid than other assets, this type of investment is better suited to longer-term investing strategies.

Commodities

Commodities are physical goods or natural resources that are produced or extracted for sale. Commodities are often traded on markets, such as the futures market or the spot market. Some examples of commodities include:

  • Agricultural products (e.g. wheat, corn, soybeans)
  • Metals (e.g. gold, silver, copper)
  • Energy products (e.g. oil, natural gas, coal)
  • Precious stones (e.g. diamonds, rubies, emeralds)
  • Livestock (e.g. cattle, pigs, chickens)

There are a few ways you can invest in commodities; directly purchasing the physical goods, (e.g. gold coins), buying and selling futures contracts or options contracts or through Exchange-Traded funds (ETFs) that track the price of a commodity or a basket of commodities.

Commodity prices are notoriously volatile as prices fluctuate rapidly and unpredictably based on supply and demand.

Exchange-Traded-Funds (ETFs) & Mutual Funds

Exchange Traded Funds (ETFs) and Mutual Funds are good places to start investing because these securities are diversified themselves. ETFs and mutual funds take money from investors and invest that money in a variety of securities that meet the stated objective of that fund. The key difference between the two is that mutual funds are actively managed, so you will pay higher fees than with ETFs.

Some funds invest in large companies, some in European companies, some in utilities, some in commodities like gold and oil, etc. For example the ETF FHLC is a collection of Health Care stocks. If you are looking for an easy way to invest in a particular industry, without having to research which particular companies you want to choose, this is a quick route to take.

Learn more about Exchange-Traded-Funds (ETFs) as well as Mutual Funds by checking out these other articles.

Asset Allocation

Asset Allocation means owning a variety of investments like real estate, stocks, bonds, gold/silver and cash. Yes, cash is an investment! For many years, the rule of thumb was to subtract your age from 100, and have that percentage of your overall value invested in stocks (so if you are 18 years old, you would invest 82% of your portfolio in stocks). The idea is that over time stocks have consistently outperformed other investments so the younger you are, the more you should be invested in stocks. As you get older and closer to retirement (when you will rely on your investments) you have less time and you would prefer the low but consistent returns of bonds and cash. Another way of putting this is that younger investors are more risk-tolerant and older investors are more risk-adverse.

This line of thinking is getting to be a little out-dated, with the rising popularity of ETFs, more choices for mutual funds, and the ability to invest in riskier bonds, but the idea of making your portfolio more risk-averse over time can still be a good idea.

Asset allocation is different from diversification – you might have a wide asset allocation, with almost no diversification!

For example, if you divided a $10,000 portfolio between 3 asset classes (Stocks, ETFs, and Mutual Funds), you could have the following holdings:

  • Stocks: Celgene Corporation (CELG) and UnitedHealth Group (UNH)
  • ETF: SPDR S&P Biotech ETF (XBI)
  • Mutual Fund: Vanguard Health Care Fund (VGHCX)

You might be divided between 3 asset classes, but the entire portfolio is still concentrated on Healthcare/Biotechnology, so it is not diversified at all.

Building a Diversified Portfolio

Now that you understand the benefits of diversification and the different asset classes available, it’s time to build a diversified portfolio that’s tailored to your individual needs and goals.

Here’s a step-by-step guide to help you get started:

Step 1: Set Your Investment Goals and Risk Tolerance

Before you start building your portfolio, take time to define your financial goals and risk tolerance.

  • What do you want to achieve with your investments?
  • Are you looking to build your wealth over the long-term, or do you want to generate passive fixed income?
  • What level of risk are you willing to take on?

Your investment goals and risk tolerance will guide all investment decisions as you create a personalized investment plan.

Step 2: Allocate Assets to Different Classes

A common approach is to allocate your assets based on your risk tolerance and the time you have left before you retire. With the goal of being able to live off your investments for a comfortable standard of living. So, you may start as an aggressive investor and become a conservative one later in life.

  • Conservative investors: allocate 80% to bonds or fixed-income assets and 20% to stocks or high-growth assets.
  • Moderate investors: allocate 40% to bonds or lower-risk assets and 60% to stocks.
  • Aggressive investors: allocate 20% to bonds and 80% to stocks.

Step 3: Select Individual Securities or Funds Within Each Class

At this stage, you are actively researching and comparing your options to reduce exposure to any one particular security or sector. When selecting individual securities or funds, consider the following factors:

  • Performance: compare the financial statements or price history between similar alternatives so you pick the best performing one for you.
  • Risk: Consider the level of risk associated with each security or fund and ensure that it aligns with your risk tolerance.
  • Fees: check what fees you will need to pay to minimize the impact on your returns.

As you make your selection, make sure your portfolio is diversified across different asset classes, sectors, and geographic regions.

Step 4: Rebalance Your Portfolio Regularly

Remember to take time either annually (or monthly) to re-evaluate your financial situation. Depending on your lifestyle or circumstances, you may need to adjust your investing plan. Rebalancing your portfolio can help you stay disciplined and focused on your investing goals, rather than making emotional decisions based on market fluctuations.

Advanced Diversification Strategies

While a well-diversified portfolio is essential for managing risk and achieving long-term success, there are several advanced diversification strategies that can help you further optimize your investment portfolio.

Sector Rotation

Sector rotation involves shifting your investments between different sectors or industries in response to changes in the market or economy. This can help you capitalize on opportunities in emerging sectors or industries, while avoiding those that are declining.

For example, if you’re invested in the technology sector and it’s experiencing a downturn, you may consider shifting your investments to the healthcare sector, which is experiencing growth.

Diversifying your portfolio with sector rotation
Image by Jason Shivers from Pixabay

Style Diversification

Style diversification involves investing in different styles or approaches within a particular sector or industry. This can help you balance out blind spots, for example if you are mostly following a buy and hold strategy, (where you intend to keep your investment 5+ years) you can allocate a portion of your portfolio to be actively managed. So you can take advantage of any short-term price fluctuations through day trading, value trading or another investing strategy.

Alternatively, within the technology sector, you may want to invest in both value and growth stocks. Value stocks are those that are undervalued by the market, while growth stocks are those that are expected to grow rapidly.

Geographic Diversification

As mentioned earlier in this article, geographic diversification involves investing in different regions or countries around the world. This can help you capture opportunities in emerging markets, while managing risk.

For example, you may want to invest in emerging markets such as China or India, which are experiencing rapid growth. While also staying invested in developed markets such as the United States or Europe, which are more stable.

Alternative Investment Diversification

Alternative investments involve investing in assets that are not traditional stocks or bonds, such as private equity, cryptocurrencies, hedge funds, or real estate.

For example, you may want to invest a small portion of your portfolio in a private equity fund that invests in small businesses or startups. Or, you may want to invest in Bitcoin, Ethereum or other cryptos to get exposure to this new market.

Keep in mind these are more advanced strategies for a reason, before dabbling with any of them, get to know how well you respond to risk. The rewards of potentially earning a higher return may not be worth the stress of trying to manage complex financial instruments.

Common Mistakes to Avoid

Over- or Under-Allocating to a Particular Asset Class

One common mistake is to over- or under-allocate to a particular asset class. This can lead to a portfolio that is too concentrated in a single asset class, which can increase your risk. Diversifying is good, but don’t go too far! If you start diversifying too much, your portfolio starts to get thin. You might not lose much if one company starts to go down, but you also won’t gain much if another company you own starts doing very well. Beginners should usually build their first portfolio on HowTheMarketWorks with between 8 and 10 stocks, ETFs, or Mutual Funds at a time. You can always switch the investments you have, but try to avoid having too many, or two few, investments at once.

Over-Diversification can also make it more difficult to manage your investments. If you’re not able to follow-up with company news and stay on top of your investments, things could start turning bad, and you could start losing one before you even know why!

Ignoring Inflation Risk

Another common mistake is to ignore the risk of inflation. Inflation erodes your purchasing power, and the value of your investments over time. If your portfolio is heavily weighted towards fixed-income investments (bonds), or you’re keeping most of your money in cash or cash equivalents, you will be exposing yourself to significant inflation risk. As you develop your investing strategies, keep in mind that your rate of return needs to be above the rate of inflation, or else your portfolio is going down in value in real terms.

Failing to Rebalance the Portfolio Regularly

Finally, failing to rebalance your portfolio regularly is a very common mistake. Think of it like spring cleaning, but instead of taking everything out of the closet to see what you want to giveaway, you are evaluating whether you want to sell-off some of your investments instead. If you make a habit of reviewing each asset you’re holding, you’ll also be able to spot opportunities you may otherwise miss.

For example, a company you own received some bad press, so the stock price went down. You review their financial statements and discover the negative market sentiment, in the other words the attitude or feeling of other investors, does not line up with the real value of the company. You decide to buy some more shares and make a short-term gain.

Summary

Learning how to diversify your portfolio is all about creating a more stable and resilient portfolio that can withstand market fluctuations. If you’re ready to start building a diversified portfolio, here are some final thoughts to keep in mind:

  • Start small and gradually increase your investments as you become more comfortable with the process.
  • Don’t be afraid to ask for help or seek advice from a financial advisor if you’re unsure about any aspect of the process.
  • Be patient and disciplined and remember that diversification is a long-term strategy that requires time and effort to achieve.

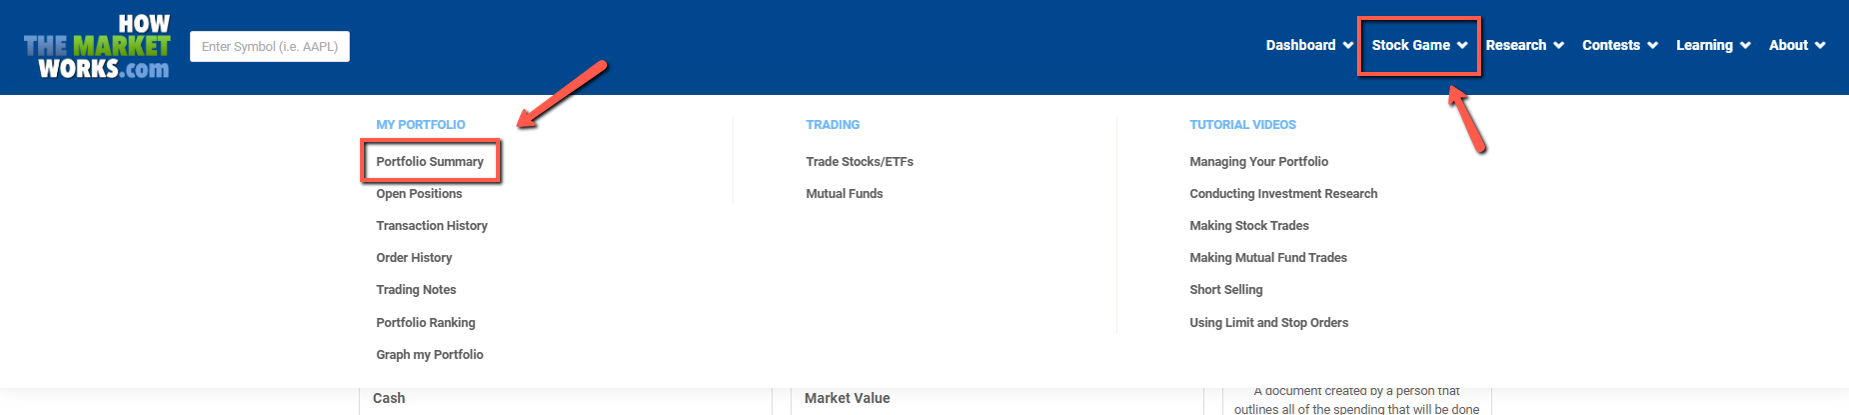
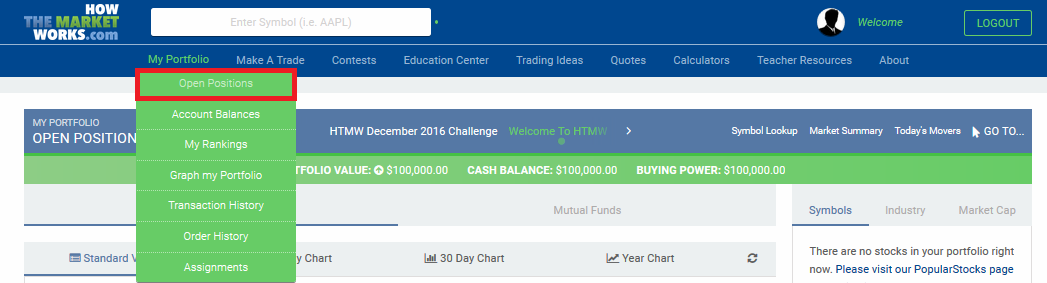
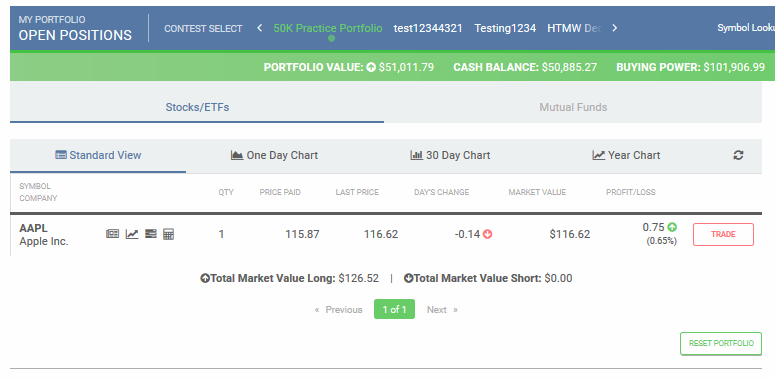
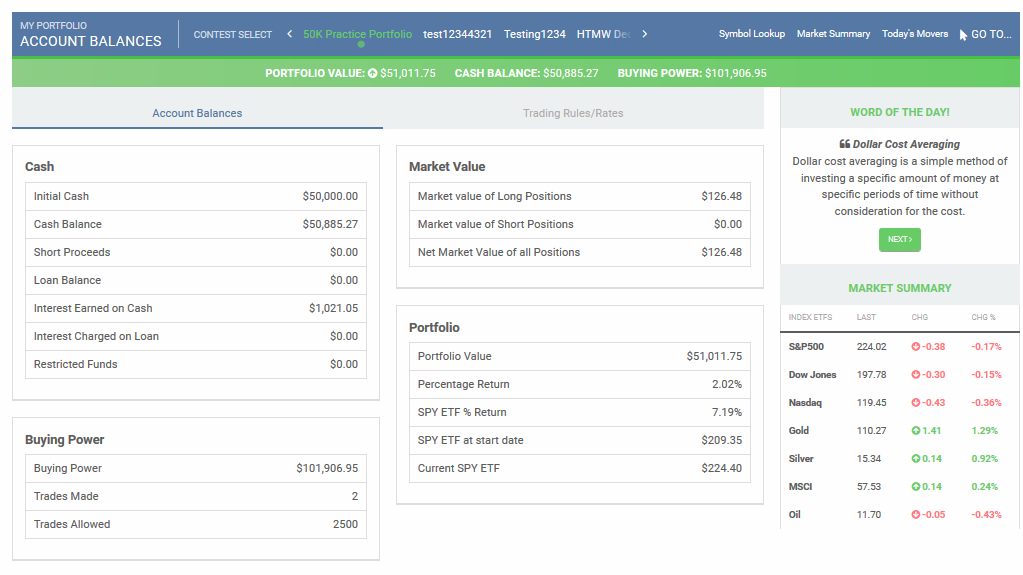
And finally, we invite you to start building a diversified portfolio today on HowTheMarketWorks, a platform that allows you to test out your investing strategies before using real money.

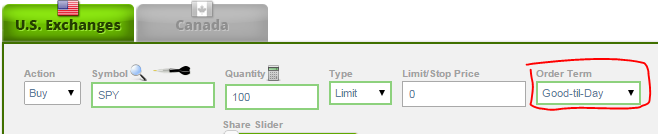
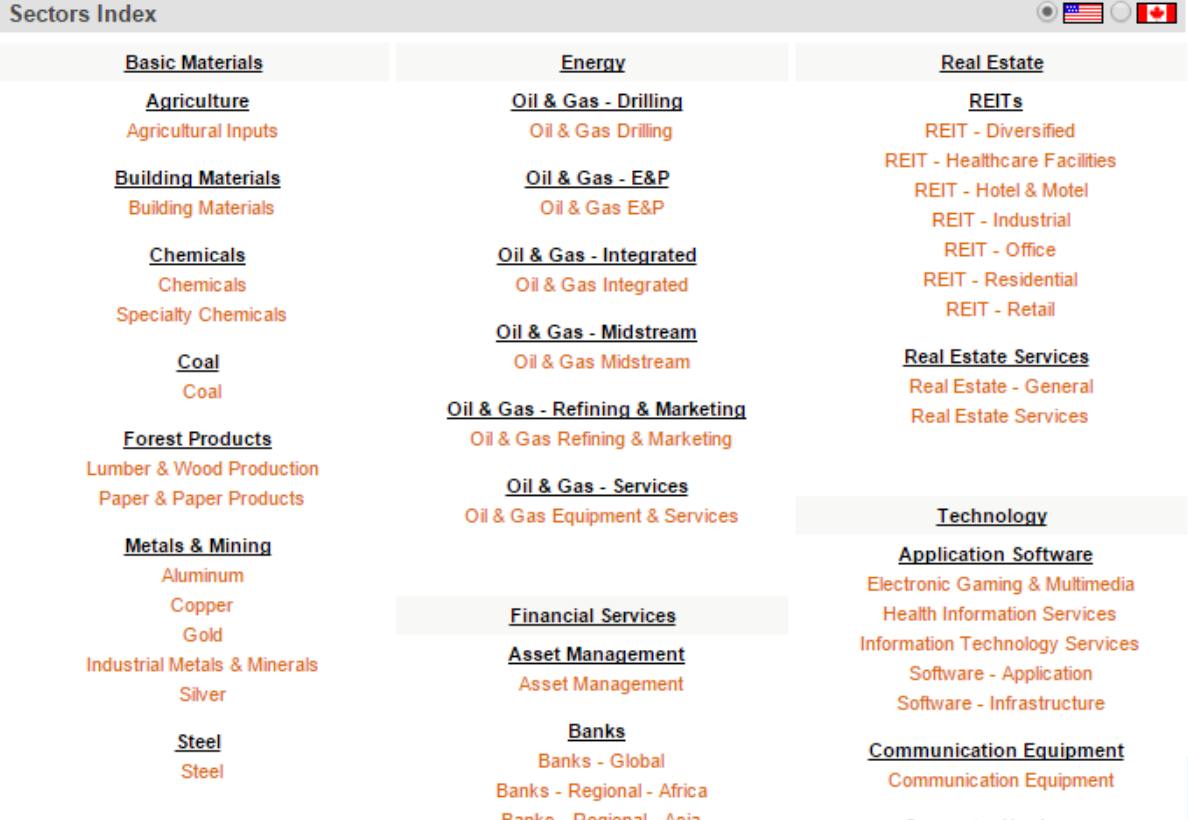
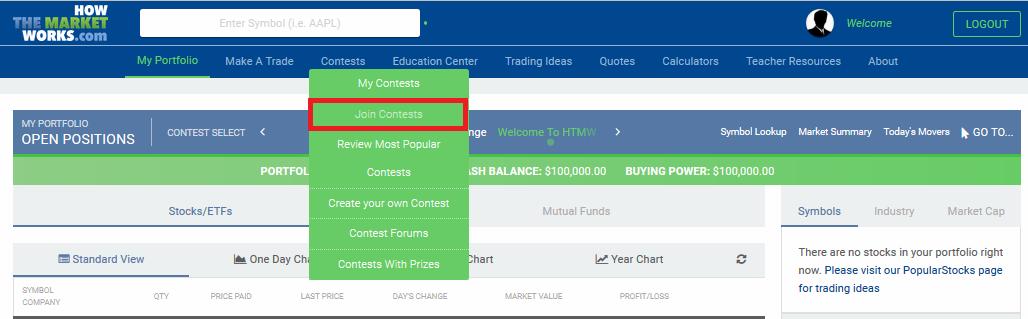
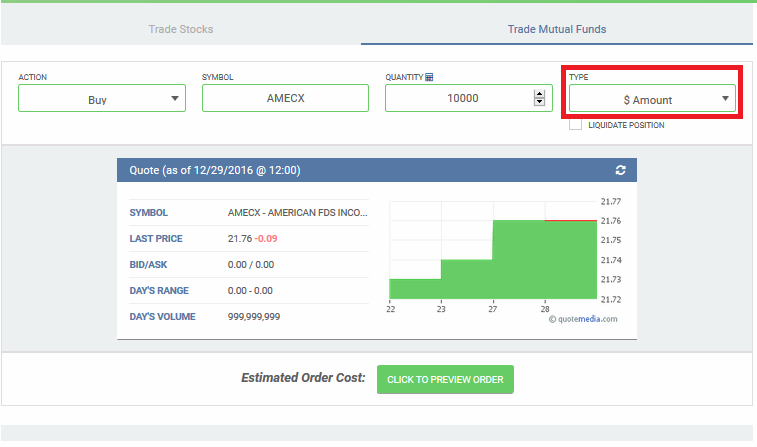
To get started building a diversified portfolio, identify five sectors from the image above that you are interested in. From each of those 5 sectors, pick one stock that you are familiar with. Determine the tickers for those stocks, get quotes, review their charts, make sure those stocks are on upward trends, and then buy those stocks in your virtual account. If you started with $100,000 then invest about $10,000 in each of those 5 stocks. Don’t be afraid, it’s only play money and you need to jump in and start learning how the market works.

So what are you waiting for? Start building a diversified portfolio today and take the first step towards achieving your financial goals!

The most challenging aspect of starting to invest is picking the first few stocks to add to a portfolio. Every investor has their own techniques and strategies, but we want to give you the tools you need to place your first trades, and get your portfolio off to a running start.

Establish Goals

Before choosing your first stock, the first step is deciding what your goals are for your portfolio.

Risk and Reward

The biggest choice you will make will be balancing risk and reward – investing all your cash in very risky assets with high growth (or loss) potential, or focus on companies that you believe can be strong in the long run.

Diversification

Once you consider how risky you are feeling, next decide how you want to diversify your portfolio, which will help you decide how much cash to invest in each symbol. Your challenge may do this automatically – most challenges include a position limit, meaning you can only invest a certain percentage of your cash in any single stock.

You can check if your contest has a position limit rule on the Account Balances page.

  1. Go to Portfolio Summary under the the Stock Game menu.

2. Click on Trading Rules/Rates.

Once you establish the minimum number of securities you need, you can now start handpicking stock symbols by using a trading strategy. You can also create a mix of these strategies to get the best of each strategy.

Trading Strategies for Beginners

“Invest in what you know” strategy

The best way to start when buying stocks is to buy what you know, not trying to follow stock tips or read a bunch of technical analysis that you cannot follow. Think of it this way: if you already know a company, they have done well enough in the past to already become a household name today. This gives you, as the investor, a big advantage; you can see how that company is doing just by looking at their stores and reading normal business news.

Ask yourself the following questions:

  • Have they started to open new stores around me lately, or are they closing some shops?
  • Does there seem to always be a lot of people you know using their products, or are they still more obscure?
  • Does their current news look positive or negative?

If all three of these are positive, then this might be a good place to invest.

Earnings Strategy

An investor can always handpick stocks based on the earnings calendar. To do so, you would have to know your investment time horizons, and flip through the earnings calendar to find gems (i.e. stocks that you can buy and that will soar during its earning season, or stocks that will tank and that can be shorted beforehand).

The Earning Strategy is somewhat of an evolution of the “Invest in what you know” strategy – you will be looking for companies that you believe will have high earnings announcements coming up soon, which can cause their stock price to rise.

Once you have found your stocks, it is very important to analyze them and back-up your assumption of how the market will react to their earnings report.

An example of a well executed trade based on the earnings’ expectations would be NVDA. Before the presentation, NVDA was trading around 102 and soared continuously every since to 149.44 on the 7th of June!

diversification rule

The Passive strategy

If you are not sure which specific stock to select, you can always invest in ETFs and market indices. These products are already diversified for you and will track a specific market for you.

As an example, let’s say you want to invest in a gaming company, but don’t know which company in specific. You can always invest in an ETF that will track the gaming market for you. In this situation, you can invest in the Wedbush ETFMG Video Game Tech ETF (GAMR), which tracks this market for you. According to amplifyetfs.com, some of their top holdings are GameStop Corp, Bilibili, Keywords Studios PLC and Pearl Abyss, which means the stock picking and allocation tasks has been already taken care of by the Fund Managers of this ETF.

You can find a specific ETFs in the following link: https://etfdb.com/etfs/.  You can also subscribe to stock newsletters to get some professional advice.  For example, here is a popular stock service and their list of Best Stocks To Buy Now.

Stock screeners strategy

You can also use stock screeners to find good purchases and short sales. A Stock Screener is a program or website that will ask you some questions about what you are looking for in a stock, and return a list of stocks that match your criteria. You can then do extra research on these stocks to determine if they should be added to your portfolio.

One of the best stock screeners is Chaikin Analytics, which offers free 90 day usage for beginners (but the free period expires after that). Check it out here.

Getting Trading Ideas

HowTheMarketWorks also has a Trading Ideas page that will help you review the overall market’s health and help you adjust your stock picks.

Today’s Market Summary

This page is very useful for the start of your research. It presents the day’s market summary. It is useful because it tells you how the overall market is doing today. As an example, on May 17th, 2017, you would notice that indices such as SPY dropped 5 points due to the “Trump-Russia” investigation. This can be used as a signal to certain investors to buy more. If an investor purchased SPY during the dip, he/she would have gained more than $5 per share! It is always important to review how the overall market is doing and the market news today. This can help you to capture the perfect timing to buy stocks at their lowest price (or to short sale them at their peak).

spy

Earnings Release

This page presents stocks’ quarterly earnings pre-announcements with the current estimate and new range. A stock’s volatility increases when it is near the earnings report.

Analyst Ratings:

The Analyst Ratings page presents the recommendations given by brokerage firms and financial analysts. This page will be useful to analyze a stock’s recommendation trend and the current average recommendation.

Best/Worst ETFs

Looking for an ETF? This page is a great place to see what ETF is currently doing well and what ETF is not well performing. These ETF can signal current market trends and help you make choices based on that.

Popular Stocks

Wondering what other users are trading? This page presents our popular stocks and mutual funds. We also present top gainers and losers and hot stories that is moving the market today. You can also find our random stock generator, which generates 3 random stock ideas!

Upgrades/Downgrades

The Upgrade/Downgrade page presents all the changes in analysts’ recommendation of symbols.

Inflation is up in the latest Consumer Price Index report, showing the first total-year increase since the financial crash.

Prices increased about 0.3% in June, and 0.4% in May. This increase in prices is welcomed by many economists and analysts; raising prices is a good sign that the economy is growing. The Federal Reserve Bank currently is holding a 2% annual inflation target, but because of the strong dollar (meaning the US dollar is comparatively “stronger” than other currencies in the global markets, making it easier to import and harder to export).

Having some inflation is necessary to spur business growth; if there is some inflation, companies have an incentive to hire people and not hold cash. If inflation is too high, prices go up too fast for wages to keep up.

To find the current inflation rates, you can visit the Federal Reserve Bank of Saint Louis’s FRED research system by clicking here. For more on this inflation report, click here to read more on Bloomberg.

More good news for the US labor market, Jobless Claims have resumed their decent last week, after 3 weeks of climbing.

This continues to signal that the US economy is beginning to see strong growth, not just recovery, in the job market after several years of being plagued by high unemployment after the 2008 financial crash. This is consistent with the Fed’s announcement that interest rates will raise this year.

When looking at the labor market, there are three reports that economists and analysts are always looking out for: the Unemployment Rate, the New Hires, and the Jobless Claims report. The relationship between these three categories can tell us a lot about the labor market as a whole; the Unemployment Rate alone will tell us how many people are out of work and looking for a job, the New Hires tells us how many jobs were created, and the Jobless Claims tells us how many people lost their jobs in the last week. So by comparing them, you can see what has happened in the job market in the last week, month, or year.

For example, if the unemployment rate is unchanged, but the jobless claims and new hires both go up, we know that no new people entered the labor force, and the number of people who lost their jobs was equal to the number of people who got new ones, so the labor market as a whole is probably unchanged.

Conversely, if the unemployment rate goes up, while new hires and jobless claims stay the same, it means that more people who previously were not looking for a job just entered the labor market, so you have more people total looking for jobs.

For more information about any of these rates, visit the Bureau of Labor Statistics. For more information on this week’s jobless claims report,

Introduction

The Sharpe Ratio is an important tool for evaluating a stock, or a portfolio, based on how risky it is to get a higher return. You can use the Sharpe Ratio to determine how consistent the returns of a stock or portfolio are, so you can determine if the returns are stemming more from wise investing, or getting lucky.

Example

Look at the performance of these two stocks:

Sharpe Ratio Example

On the first day we track and the last day, these two investments have the same value. However, Stock 1 is very consistent in its returns, while Stock 2 has a very wide range of variance. In this example, if an investor holds both these stocks for 13 days, their return would be the same for both.

However, imagine if the investor sold both stocks on Day 11. The return for Stock 2 would be much higher! But if they waited just one more day, on day 12 Stock 2’s value crashed down, so Stock 1 looks like a better choice.

How To Use The Sharpe Ratio While Investing

When saving and investing, the goal should always be consistent returns and capital preservation; you do not want to make risky moves that could wipe out all the savings you put in. A wise investor would always prefer Stock A, since they do not need to worry about timing the market, instead they can focus on building a strong long-term portfolio, instead of focusing on when to buy and sell some hot stocks at the best prices.

In this example, Stock A would have a much higher Sharpe Ratio than Stock B, because it has much less variance for the same return at the end of the period we looked at.

You can expand this concept to an entire portfolio; if your portfolio value swings up and down a lot, but you end with a higher value, you will have a much lower Sharpe Ratio than someone else who may have a lower final return, but their portfolio value grew at a more consistent rate throughout the trading period.

For more advanced information about the Sharpe Ratio, and how to calculate it yourself in Excel, visit our Sharpe Ratio (Advanced) page.

The Chairwoman of the Open Market Committee of the Federal Reserve Bank, Janet Yellen, announced today that the prime lending rate will almost certainly be increased this year, based off strong labor market data and economic growth around the United States.

The Federal Funds Rate has been set near 0% for the past several years as part of the Fed’s efforts to use monetary policy to help the economic recovery in the United States. This interest rate is used to determine the interest rate that banks use to lend cash to each other, which also influences the interest rates that companies and people can borrow money.

The lower the interest rate, the cheaper it is to borrow money, so companies can borrow more money to expand, and people can buy more houses (and more houses are built). However, if people are borrowing too much money, it will eventually lead to too much risk in the economy. The Fed generally raises interest rates while the economy is growing strongly, and lowers them when the economy is having trouble.

Click Here to read more about the Fed

Registration And Site Overview

New to HowTheMarketWorks? These videos will give you a great picture of how to get around the site, and how to use some of the most popular features

Registration And Site Overview

My Portfolio, Open Positions, And Rankings Pages

Trading Stocks

Trading Mutual Funds

Teacher Tools And Research

Creating your own contest? Looking to start doing stock research? Wanting to look at some more advanced order types? This is the place!

Contest Creation

Research on HowTheMarketWorks

Short Selling

Different Order Types (Limit, Stop, and Market Orders)

We have been giving a lot of attention to Greece and China recently in our “Top Stories”, and with good reason!

Greek debt has been spiraling outwards since the financial crash in 2008, but there has been severe resistance to “austerity measures” (another way of saying spending cuts, usually targeting social programs like retirement pensions) that would be necessary to balance their budget and get on good terms with their creditors (particularly France and Germany). The referrendum on July 5th was engineered by the current Prime Minister, Alexis Tsipras, who was elected on the promise to fight these measures and prevent drastic cuts to social spending.

However, by avoiding these cuts, it meant that Greece would be unable to pay its bills to other countries and the International Monetary Fund. This was a big risk; it could mean that Greece would be unable to continue to use the Euro as their currency, and could even be removed from the European Free Trade Zone, if the European Union decided the violations were serious enough.

These threats were so strong that Tsipras, despite all rhetoric, did agree to creditor demands last week, and Greece will enact the austerity reforms necessary to continue to use the Euro. This is far from the end of Greece’s financial and economic problems, but it does keep the door open for more European investment, loans, and support.

Read More on Bloomberg

China’s stock crash and Greece’s debt crunch have been dominating news in the last couple of weeks, but these two stories have been making large waves, it seems, because they are the global outliers, not the norm.

Thanks to increasing domestic demand, and continued support from central banks, economies around the developed world have been picking up steam at a strong rate over the last year, and top analysts expect them to continue to do so. This growth is driven, in large part, by increases in domestic demand; producers and consumers at home have been demanding more goods and services, which in turn has driven increases in output and employment as firms seek to fill all the increasing orders.

So what keeps the Greek and Chinese problems from spreading everywhere else, when the banking crisis from 2008 spiraled out to affect almost everyone? The simple answer is that the parts of the economies affected by these crises are fairly separate, so it is very hard to spread outwards. Chinese stocks may have lost a lot of value, but they only account for around 20% of household wealth, and even less of corporate wealth, in China. Outside China, the percentage is even less, due to capital controls China has historically used to prevent foreign companies from taking too much control of Chinese firms.

Compare this to the Banking Crisis in the US, Iceland, UK, and many other Western European countries in 2008: most of the “wealth” held by many individuals has historically been tied up in housing, so when housing prices crashed, the wealth and savings of a very high percentage of the population was slashed. Banks themselves also had much of their equity tied up in home loans, which drove them into dire straights as value dropped, which caused the crash to start snowballing into a global problem.

Read more on Bloomberg

The head-and-shoulders pattern is one of the most popular chart patterns in technical analysis. It’s popularity is mainly attributed to the fact that it easy easier to spot than other patterns. It’s name comes from what the pattern looks like: A head and two shoulders (and a neckline).

The pattern indicates a reversal is likely to happen after the pattern has been completed. The head and shoulders pattern comes in two forms, top and bottom. The bottom head and shoulders pattern is very similar to the double bottom pattern or triple bottom pattern and are similar in many ways.

If we look at a graphical representation of the Top Head and Shoulder Pattern we can see that the pattern is composed of two shoulders, a head, and a neckline:

HaS1

The pattern does not need to look exactly like this, but it does need to follow a couple guidelines:

  1. The pattern must start with an upward trend and have a head that is higher than the two shoulders.
  2. The shoulder heights should also be roughly the same height, though the troughs can be different heights (ascending troughs are more desirable, that is to say the second trough is higher than the first trough).

In this graph, H stands for height and, in general, we can set our target price (to exit the position) roughly the same height between the difference of the neckline and the top of the head. The downward trend is likely to hit the target price of the same difference H between the neckline and the target. This is a good place to put a stop loss order.

Another thing to note is that the pullback is not necessarily always part of the pattern, it only happens about half the time. It does not have to go over the neckline, (it is even preferable that it does not) and should not be there long, or pass the neckline by a large amount. Top patterns are fairly reliable and take a downward exit (past the neckline) in approximately 90% of cases.

Here is also an example of a Bottom Head and shoulder without pullback.

has2

This chart is almost identical to the Top and head shoulder and follows the same rules but inverted.

Volume:

The underlying volume is a key indicator in successfully trading this pattern. Without volume the pattern is considered weak at best and is far more risky to trade.

hsa0

Above, we can see that when the stock first crosses the line at the first bubble many would be tempted to trade the stock as it is fulfilling the pattern. That may have been very risky as it could simply have been a momentary decline without much strength. The far safer and more important time to trade is when the stock continues with it’s support and trades down with significant volume. This is a far stronger indication of trend.

To summarize, head and shoulders are one of the first patterns students learn in technical analysis. It is important to not only look at the pattern but to have a strong volume when breaking through the neckline or various supports and resistances.

If you follow our news stories at the top of the page, you may have noticed that a lot of the unemployment stories we focus on are generally good; US jobless claims have been falling drastically over the last 6 months, US overall unemployment rate is the lowest it has been since 2008, and the job creation rates have been steadily improving to match.

However, while this is good news for the US, it is not a universally rosy picture around the world. Developed countries with still-weak economies, like Spain and Greece, are still strugging with unemployment reaching as high as 20%. Even stronger countries are struggling with high numbers of “Long-Term” unemployed; people who may have lost their jobs years ago, have never been able to find work, and simply stopped looking. If you are not actively looking for work, you are not counted as unemployed, which makes the reported numbers lower.

If you want more information on US unemployment, employment, and job creation, check out the Bureau of Labor Statistics, which keeps all labor records for the US. If you are looking for data from around the world, the World Bank collects data from almost every country in the world, and keeps it in one place to make everything easy to find.

On Wednesday, the DOW fell over 150 points in the morning, in large part due to investor confidence being severely shaken by the massive selloff in China, and the aftershocks of the Greek referendum.

Investors around the world are reeling form these two combo-shocks, we have talked about some of the causes of the Chinese crash Here, but CNN has also published a brief explanation Here

As for the Greek crisis, the causes and future path are a wide path of economic issues, the Wall Street Journal has done a good job of putting together a point-by-point summary here for anyone who needs a primer on what went, and continues to go, wrong.

In a landslide, the Greek voters rejected the terms of the European Union bailout package on July 5th, 2015. The vote was whether or not to accept the terms laid out by European creditors, namely France and Germany, to get Greek finances in order as a condition for further loans from the European Central Bank.

The conditions included, among other things, stronger austerity measures (cuts to government spending on things like pensions and social welfare entitlements), and tax increases to strengthen the Greek government’s financial positions.

The rejection of the proposal means that European lenders will no longer be extending more lines of credit to the Greek government, which is quickly running short on funds. Greek banks have already been closed for a week, as they do not have capital requirements to extend loans. Greek citizens have been limited to 60 euro per day ATM withdraws, and hoarding of 20 Euro notes has led to an overall shortage (so even ATM withdraws have become problematic).

If Greece does exit the Euro and needs to begin printing its own money to manage its debt, most analysts predict that the purchasing power of its citizens will drop between 30 and 60% overnight, as the resurrected Greek currency is quickly devalued against the Euro, and could be a catalyst to even greater financial strife in the months and years to come.

Read More on Bloomberg

The Greek financial system was nearing the brink of collapse early Monday morning as banks were closed and capital controls have been placed over government bodies as they prepare for the last round of efforts to keep themselves in the Euro Zone.

Greece has pledged to hold a referendum on July 5th to approve the terms from the last negotiations, Germany has stated that the result of this vote will determine whether or not Greece can stay.

The West’s largest economies have all been eager to keep Greece in the Euro over the last few months, but mounting pressure over the Greek ability to repay loans has made the stance increasingly unpopular in some of Europe’s biggest economies.

Read More on Bloomberg

The Supreme Court has voted 6-3 to uphold the Affordable Healthcare Act, commonly known as Obamacare, in a landmark decision that effectively killed the last efforts of conservative lawmakers to have the law removed.

This battle has been continuing for years; almost since Obama’s inaguration speech lawmakers on both sides of the isle have been arguing about the next step forward for healthcare reform. Some analysts have argued that this decision may help the law makers most intent on repealing the law; deep red-state Republicans, since its repeal would hit their constituents the hardest if the current healthcare subsidies were removed.

Read More at LA Times

Dow Jones Industrial Average

Definition

The Dow Jones Industrial Average, more frequently known as the Dow or the Dow Jones, is a stock market index made up of 30 of the largest publicly-owned companies based in the United States. It’s a price weighted index meaning that the index’s price is an average of the price of the 30 stocks that make it up. Though it’s price weighted, this does not mean that every time there is a split the index is completely changed, as they have factors to keep the value of the index consistent.

Dow Jones Industrial Average

The Dow Jones Industrial Average was first calculated on May 26, 1896 by Charles Dow and one of his business associates, statistician Edward Jones. It is the second oldest U.S. market index, though the contents of the index have changed multiple times. Its purpose was as straightforward as it was revolutionary.

At the time, everyone who wanted to know how the stock market was doing had to filter through numerous newspapers, journals, and hearsay, which was a huge amount of information that was very difficult to process. Dow and Jones built the averages as a market thermometer, so a casual observer could see whether the markets as a whole were moving upwards or downwards over a given day.

The average is not a simple average of the prices of all of its components; rather it is a weighted average taking into account the differences in stock prices of all companies it tracks, and measures the change of the group as a whole. By choosing the largest and most stable companies in each of the main industrial sectors, the average acts as a stable indicator to how the markets as a whole are performing.

While there are not many companies in the Dow, it is made up of some very large, and very stable, Blue Chip Stocks. Since these businesses have proven their value over time, the ups and downs of the Dow can be a very strong indicator of investor sentiment across the entire economy.

Current Companies in the DOW:

SymbolCompany NameQuotes and Charts
AMZNAmazon.com IncAMZN
AXPAmerican Express CoAXP
AMGNAmgen IncAMGN
AAPLApple IncAAPL
BABoeing CoBA
CATCaterpillar IncCAT
CSCOCisco Systems IncCSCO
CVXChevron CorpCVX
GSGoldman Sachs Group IncGS
HDHome Depot IncHD
HONHoneywell International IncHON
IBMInternational Business Machines CorpIBM
INTCIntel CorpINTC
JNJJohnson & JohnsonJNJ
KOCoca-Cola CoKO
JPMJPMorgan Chase and CoJPM
MCDMcDonald’s CorpMCD
MMM3M CoMMM
MRKMerck & Co IncMRK
MSFTMicrosoft CorpMSFT
NKENike IncNKE
PGProcter & Gamble CoPG
TRVTravelers Companies IncTRV
UNHUnitedHealth Group IncUNH
CRMSalesforce IncCRM
VVisa IncV
VZVerizon Communications IncVZ
DISWalt Disney CoDIS
WMTWal Mart Stores IncWMT
DOWDow IncDOW

What is an Index?

HowTheMarketWorks Header
Hello!
Reg

This is an A to Z guide on the basics of using How The Market Works. We’ll cover everything you need to know about using our site and all the tools you have at your disposal. Let’s Begin!

Registration

Whether you’re a student, teacher or just someone looking to learn and practice, everyone starts by registering a new account. If someone has sent you an invitation link to join their contest, the link will take you straight to the registration page. If not, then all you have to do is click “CREATE ACCOUNT” from the main menu on our homepage.

Reg

Now just scroll down and fill in all the necessary information to create your HTMW account. If you found your way here be using a contest invitation, then you’ll automatically be registered into the contest as soon as you finish creating your account. You’ll receive a confirmation email with your account details so hold onto that in case you forget anything.

Contests

Most users are joining a contest for their class or club, which is great! There are two ways to get into the contest you’re looking for:

  1. Join it directly when registeringThis is the most common way to do it, if the person who asked you to join the contest gave you a link that took you straight to the registration page, you’re already in the contest! You can tell because the registration page had the name of the contest you were joining:

  2. Find the contest on the Contests page

    If you didn’t register directly into the contest, you can still join by using the “Join Contests” page. You can find it right in the top menu if you hover over the “Contests” tab:
Reg


You can also find the page here: https://app.howthemarketworks.com/contests/find

From here, just search for the contest you’re looking for, or even join one of the public contests!

Active Contests

The most important thing to remember before trading or doing anything else, is setting your active contest to the right one. In almost every page is a “Contest Select” menu where you can select which contest of yours you want to view or places trades in. Here’s an example from the open positions page:

Reg

The initial default contest is your practice portfolio, however the system will save whatever contest you last set to active and make it your default the next time you log in. As long as you keep accessing the site from the same device you won’t have to worry about changing it more than once if you only have 1 contest.

From now on, you can assume that the first step in anything mentioned in this guide is to always make sure you have the right contest selected!

With that out of the way it’s time to move onto something more interesting!

How to Trade

Trading is the heart and soul of HTMW and it’s probably why you came here in the first place.

Let’s start by learning how to trade stocks.

Trading Stocks

Reg

To begin, go to “Make a Trade” on the menu bar and then select “Trade Stocks/ETFs” from the sub menu, as seen below:

This will take you to the stock trading page where you can begin trading. We’re going to go cover what each part of the trading tool does so that you know exactly what you’re doing when making trades.

Reg

1. Action – This is where you set what kind of order you’re going to make. You can buy, sell, cover or short a stock. The default is always buy, so if you want to get rid of one of your stocks, don’t forget to change the order type of you’ll end up with even more of it! Most of your orders will probably be buying and selling, unless your a bit more advanced user.

2. Symbol – This is where you enter the symbol of the stock or ETF you wish to trade. In the above example I entered AAPL, which is the stock symbol for Apple. As you can see, once you enter the stock symbol, a quote appears telling you all the important information about the stock as well as a chart that show the stock’s movement during the current trading day.

3. Quantity – Here is where you enter how many shares you want. If you accidentally ask for more than you can afford, don’t worry! The system will stop you from accidentally going bankrupt or breaking any rules.

4. Type – This is where you set the order type. The default is always a Market order and this is what most people will use the vast majority of the time. Market orders will fill you as soon as possible at whatever the current trading price is. Limit and Stop orders allow you to set a specific price that will determine when your order fills. You can go here for more information on how the different order types work.

5. Limit/Stop Price – If you’re using a market order, as in the example above, this box will be greyed out since you don’t set a price for market orders. If you’re not using a market order, this is where you enter what you want your limit or stop order price to be.

6. Order Term – The order term is where you decide when you want open orders to expire. Market orders are always set to expire at the end of the current trading day. If you place an order while the markets are closed then your order will be come active at the start of the next trading day. If you’re using limit/stop orders then you have the option to choose “good-til-cancel” as your order term. This will keep your orders open until either your limit/stop price is hit, or you manually cancel the order.

7. Share Slider – If you’re not sure exactly how many shares you want, you can use the share slider to adjust the quantity anywhere from 1 share to the maximum you can afford. As you move the slider the system will calculate the total cost which allows you to quickly see how much you’d be spending for  different quantities, instead of having to manually enter a new number for every estimate.

8. Order Preview – Once you’ve entered in all the necessary information, the order preview will give you the estimated cost of your transaction. If you like what you see, hit the “Preview Order” button and you’ll get a final confirmation request. The “Preview Order” button will change to “Confirm Order”. Now if everything looks good, hit the confirmation button and that’s it! You’ve placed your first stock order!

Now lets move on to trading Mutual Funds.

Trading Mutual Funds

This time go to “Make a Trade” on the menu bar and then select “Trade Mutual Funds” from the sub menu, as seen below:

Reg

This will take you to the mutual fund trading page. You’ll notice it looks fairly similar to the stock trading tool, but there are a couple of key differences to note which we’ll talk about below the example image.

Reg

As you can see, for mutual fund orders there is only an action, symbol and quantity that need to be set. Mutual fund orders are always market orders and they are always good-til-day so there is no need for the other options.

Unlike stocks, you cannot short mutual funds, so the only available actions are buying and selling. Another important difference you need to be aware of is that by default, mutual fund order quantities are listed in dollar amounts and not units. You can change the setting by using the highlighted drop down menu shown above. Make sure you know what it’s set to as this will completely change how much you end up buying or selling. $1000 worth of a fund is usually very different from 1000 units (basically the same as shares).

Since the price of mutual funds is only settled at the end of the trading day, mutual fund orders only fill after the markets close. So don’t worry if your ordering is sitting open all day long, they will usually fill sometimes after 6pm Est.

Managing Your Portfolio

Now that you have bought a few stocks and mutual funds, its always a good idea to keep track of what you have! You already have a lot of information on your portfolio right at your fingertips.

Open Positions

Now that you’ve started trading, you’ll no doubt want to keep track of everything you’ve bought. The easiest way to do this is to the “Open Positions” page found under the “My Portfolio” tab.

Reg

Reg

Your open positions page gives you a quick view of all the stocks you own, displaying important information such as the price you paid, what they’re worth now and how much you’ve gained or lost for each one. The “Mutual Funds” tab shows you the same information for your mutual funds if you have any.

You also have the option of seeing each position as mini one-day, 30-day or 1-year charts. The default tab is “Standard View” (found right above your list of open positions) and you can toggle between the different charts by selecting the appropriate tab.

Account Balances

Next to the “Open Positions” tab shown above, you’ll find the “Account Balances” tab. This is where you’ll go to get more detailed data on your current portfolio. You have 2 different options here :

  1. Account Balances:
    • The “Cash” section which covers your cash balances
    • The “Market” section provides the value of your open positions.
    • The “Portfolio” section which gives you information on your portfolio value, gain/loss and some other important details.
    • The “Buying Power” section which provides information on your buying power, the number of trades made and allowed.
  2. Trading Rules/Rates:
    • This section details all the rules set by the contest’s creator such as positions limits and whether or not day trading is allowed.
Reg

Transaction History

A bit farther down the menu you can find your Transaction History

Reg

This is where you can see all your orders that have executed, plus all the dividends that have been paid to your stocks. We pay out dividends on the ex-dividend date, and the whole process is automatic, so you never need to worry about missing one. We also handle all splits, and you can see those here as well.

You can change the dates that you want to look at, in case you only want this week, or several months.

Order History

Under your Transaction History is your Order History page:

Reg

Here you can see all your orders, whether or not they have executed. For example, in the screenshot here, I have an order that has not yet executed, so I have the option to cancel it.

All orders placed after 4pm will be “pending” until the next market open, so you can always cancel them overnight. Mutual fund orders will be open until 6pm on the day you bought them, when they execute. If you placed a good-till-cancel limit order, and you want to cancel it, this is the only place to do so.

Graph My Portfolio

If you want to see your portfolio value over time, and compare it with an index like the S&P 500, or Gold, you can do so at Graph My Porfolio. You can switch between a 1 month and 3 month view.

Reg

Rankings

One of the most popular places on HowTheMarketWorks is the rankings page. There are no rankings for the official practice portfolio, but if you join a contest you can see your performance against everyone else in that contest.

Rankings are divided by Overall, Weekly, and Monthly

Trading Ideas

Not sure where to start? Don’t worry! We have tons of resources to get you started.

We have several different options under our “Trading Ideas” tab, check them all out if you’re feeling “stock” and aren’t sure what to look for. We even have an option to “Throw Darts” for completely fresh ideas (these are chosen from a list of popular stocks, and show the price and if the stock is up or down).

Quotes and Research

Doing stock research is a huge topic in and of itself, but if you want to do research, look up company info, check out the day’s market summary, and much, much more, check out the Quotes tool!

Creating A Contest

If you want to create a contest, check out our Contest FAQ section here:

https://www.howthemarketworks.com/using-htmw/contest-help/

You can find a lot of information, including tutorial videos and a step-by-step guide to getting your contest going!

The world’ biggest brewer is trying to stay at the top spot! Anheuser-Busch InBev has been the top dog for beer for the past few years, with its flagship beers in the United States, Budweiser and Bud Light, ranking as the most common across the nation.

However, “most common beer” is meaning less and less and more and more consumers have been moving to craft beers and microbrews, made by a wide range of smaller brewers, which has been very quickly eroding InBev’s total market share.

Their solution has been acquisitions, buying up some of the most popular micro-brewers in the US to satisfy the consumer demand for artisanal beers without eroding their own market dominance. Some companies, like Goose Island in Chicago and Elysian Brewing in Seattle, hesitated before the purchases but have been mostly happy moving forward. The previous owners, and master brewers, have been happy with the approach, which they claim has allowed them to reach wider markets without any pressure to compromise techniques or ingredients.

Only time will tell if this strategy of “buy up then hands off” will continue, but beer drinkers everywhere are watching carefully.

Read More On Bloomberg

Walmart is not the only major retailer to be increasing their minimum wages for all employees; Ikea has increased their minimum wages for US workers for the second year in a row.

Both major retailers reported much lower labor turnover rates after increasing the wages. However, Ikea, unlike Walmart, offers its wage increases based off the “Cost of Living” in each of the 40 US cities where it currently operates. Walmart has a flat minimum across all locations.

Labor groups have been pushing for a universal increase to a $15/hour minimum wage across all retail and service industries, a push that has been supported by a series of very public protests by workers in several cites.


Read More on Yahoo! Finance