Definition:
Dollar cost averaging is a simple method of investing a specific amount of money at specific periods of time without consideration for the cost. For example; you decide to take $100 a week out of your paycheck and have it automatically set aside to fund the purchase of a stock or bond each week. For the sake of simplicity, the stock originally sold for $20 per share so each week you were initially able to purchase 5 shares. Later the stock price increased to $25 per share so now you can only purchase 4 shares. Notice, the number of shares has declined but the original value of the first shares increased.

Month 1 Month 2
5 shares at $20 = $100 5 shares worth $25 = $125


The rationale is that buy purchasing at a steady rate, you will benefit from the increases while negating the decreases. But does it actually work? According to a landmark bit of research conducted by the Journal of Financial & Quantitative Analysis in 1979…No, it doesn’t measure up to lump sum investing when comparing total return. Statistically speaking the overall rate of return was less for dollar cost averaging. On the other hand, dollar cost averaging does provide a return – just not quite as high as that of lump sum investing. It is also a valuable way to begin investing especially for new investors.

More Detail:
Hereafter, the typical cost per share of the security will come to be smaller and smaller. Dollar cost averaging decreases the chance of investing a big amount in an individual investment at the incorrect time. For example, you decide to buy $100 worth of XYZ every month for three months. In January, XYZ is worth $33, so you purchase three shares. In February, XYZ is worth $25, so you purchase four extra shares this time. Finally in March, XYZ is worth $20, so you purchase five shares. Totally, you bought 12 shares for an medium price of approximately $25 each.

Definition:
Fundamental analysis is the process of looking at the basic or fundamental financial level of a business, especially sales, earnings, growth potential, assets, debt, management, products, and competition. This type of analysis examines key ratios of a business to determine its financial health and gives you an idea of the value its stock.

Many investors use fundamental analysis alone or in combination with other tools to evaluate stocks for investment purposes.

Goal of Fundamental Analysis

The goal is to determine the current worth and, more importantly, how the market values the stock. Usually fundamental analysis takes into consideration only those variables that are directly related to the company itself, rather than the overall state of the market or technical analysis data but here I’m going to describe a top down approach to the typical fundamental evaluation.

How is the Economy Performing Overall?

It starts with the overall economy and then works down from industry groups to specific companies. As part of the analysis process, it is important to remember that all information is relative. Industry groups are compared against other industry groups and companies against other companies. It is important that companies are compared with others in the same group.

First and foremost in a top-down approach would be an overall evaluation of the general economy. When the economy expands, most industry groups and companies benefit and grow. When the economy declines, most sectors and companies usually suffer. Once a scenario for the overall economy has been developed, an investor can break down the economy into its various industry groups.

If the prognosis is for an expanding economy, then certain groups are likely to benefit more than others. An investor can narrow the field to those groups that are best suited to benefit from the current or future economic environment.

Economic Expansion

If most companies are expected to benefit from an expansion, then risk in equities would be relatively low and an aggressive growth-oriented strategy might be advisable. A growth strategy might involve the purchase of technology, biotech, semiconductor and cyclical stocks.

Economic Contraction

If the economy is forecast to contract, an investor may opt for a more conservative strategy and seek out stable income-oriented companies. A defensive strategy might involve the purchase of consumer staples, utilities and energy-related stocks.

To assess a industry group’s potential, an investor would want to consider the overall growth rate, market size, and importance to the economy. While the individual company is still important, its industry group is likely to exert just as much, or more, influence on the stock price. When stocks move, they usually move as groups.

Once the industry group is chosen, an investor would need to narrow the list of companies before proceeding to a more detailed analysis. Investors are usually interested in finding the leaders and the innovators within a group.

Detailed Analysis

The first task is to identify the current business and competitive environment within a group as well as the future trends.

  • How do the companies rank according to market share, product position and competitive advantage?
  • Who is the current leader and how will changes within the sector affect the current balance of power?
  • What are the barriers to entry?

Success depends on an edge, be it marketing, technology, market share or innovation. A comparative analysis of the competition within a sector will help identify those companies with an edge, and those most likely to keep it.

At this point you will have a shortlist of companies and the final step to this analysis process would be to take apart the financial statements and come up with a means of valuation. Some of the more popular ratios are found by dividing the stock price by a key value driver.

Fundamental Analysis Tools

These are the most popular tools of fundamental analysis. They focus on earnings, growth, and value in the market. For convenience, I have broken them into separate articles. Each article discusses related ratios.

However, before you dive too deep into it, you might want to read this Motley Fool Review to find out how they pick stocks based on company fundamentals.

The articles are:

  1. Earnings per Share – EPS
  2. Price to Earnings Ratio – P/E
  3. Projected Earning Growth –PEG
  4. Dividends
  5. Return on Equity

While each of these factors may not be significant on its own, combining them and tailoring your approach to the sector and company you’re analyzing can be very effective in identifying the true value of a stock. By doing so, you can determine the “ticket price” of your potential investment and assess whether your current investments have reached their full potential.

This methodology assumes that a company’s stock price is tied to its earnings, revenue, or growth. Investors can rank companies based on these valuation ratios. Those with high multiples may be considered overvalued, while those with low multiples may be considered good value. However, it’s also possible that low-multiple companies are poor performers, while high-multiple companies have room to grow.

Remember that the market is usually right in the long run.

After all this work you will be left with a handful of candidates and this is where I recommend using technical analysis to develop a trading plan for each one of them.

I know investors tend to shy away from technical analysis but this a grave mistake, in my opinion. Knowing how to read charts and understanding that technical analysis is in fact understanding basic human psychology will help you maximize your gains and minimize your losses; how does that sound to you?

So here, in a nutshell, are the advantages and disadvantages of fundamental analysis.

Advantages

Fundamental analysis is good for long-term investments based on long-term trends, very long-term. The ability to identify and predict long-term economic, demographic, technological or consumer trends can benefit patient investors who pick the right industry groups or companies.

Sound fundamental analysis will help identify companies that represent a good value. Some of the most legendary investors think long-term and value. Graham and Dodd, Warren Buffett and John Neff are seen as the champions of value investing. Fundamental analysis can help uncover companies with valuable assets, a strong balance sheet, stable earnings, and staying power.

One of the most obvious, but less tangible, rewards of fundamental analysis is the development of a thorough understanding of the business. After such painstaking research and analysis, an investor will be familiar with the key revenue and profit drivers behind a company. Earnings and earnings expectations can be potent drivers of equity prices. Even some technicians will agree to that. A good understanding can help investors avoid companies that are prone to shortfalls and identify those that continue to deliver.

In addition to understanding the business, fundamental analysis allows investors to develop an understanding of the key value drivers and companies within an industry. A stock’s price is heavily influenced by its industry group.

By studying these groups, investors can better position themselves to identify opportunities that are high-risk (tech), low- risk (utilities), growth oriented (computer), value driven (oil), non-cyclical (consumer staples), cyclical (transportation) or income-oriented (high yield).

Stocks move as a group.

By understanding a company’s business, investors can better position themselves to categorize stocks within their relevant industry group. Business can change rapidly and with it the revenue mix of a company. This happened to many of the pure Internet retailers, which were not really Internet companies, but plain retailers. Knowing a company’s business and being able to place it in a group can make a huge difference in relative valuations.

Disadvantages

The main disadvantage for me is that if used on its own, fundamental analysis doesn’t take into consideration the herd mentality phenomenon.

  • In the long run, the price per share (PPS) of companies is driven by their earnings, i.e., the profit they’re yielding.
  • In the short term, the momentum can be quite influential on the PPS.

I’m sure you’ve noticed that some stock are considered market darlings and, to a certain degree, it doesn’t matter what their quarterly results are; people keep on buying. The same applies for companies that, all of a sudden, fall out of favor for whatever reason, genuine or not. They keep getting hammered regardless of the results the company pumps out, until one day it reverses. Fundamental analysis doesn’t consider this irrational behavior.

Fundamental analysis may offer excellent insights, but it can be extraordinarily time-consuming. Time-consuming models often produce valuations that are contradictory to the current price prevailing on Wall Street. When this happens, the analyst basically claims that the whole street has got it wrong. This is not to say that there are not misunderstood companies out there, but it is quite brash to imply that the market price, and hence Wall Street, is wrong.

Valuation techniques vary depending on the industry group and specifics of each company. For this reason, a different technique and model is required for different industries and different companies. This can get quite time-consuming, which can limit the amount of research that can be performed.

Fair value is based on assumptions.

Any changes to growth or multiplier assumptions can greatly alter the ultimate valuation. Fundamental analysts are generally aware of this and use sensitivity analysis to present a base-case valuation, a best-case valuation and a worst-case valuation. However, even on a worst-case valuation, most models are almost always bullish, the only question is how much so.

The majority of the information that goes into the analysis comes from the company itself. Companies employ investor relations managers specifically to handle the analyst community and release information. As Mark Twain said, “there are lies, damn lies, and statistics.”

When it comes to massaging the data or spinning the announcement, CFOs and investor relations managers are professionals. Only buy-side analysts tend to venture past the company statistics. Buy-side analysts work for mutual funds and money managers. They read the reports written by the sell-side analysts who work for the big brokers (CIBC, Merrill Lynch, Robertson Stephens, CS First Boston, Paine Weber, DLJ to name a few).

These brokers are also involved in underwriting and investment banking for the companies. Even though there are restrictions in place to prevent a conflict of interest, brokers have an ongoing relationship with the company under analysis. When reading these reports, it is important to take into consideration any biases a sell-side analyst may have. The buy-side analyst, on the other hand, is analyzing the company purely from an investment standpoint for a portfolio manager. If there is a relationship with the company, it is usually on different terms. In some cases this may be as a large shareholder.

When market valuations extend beyond historical norms, there is pressure to adjust growth and multiplier assumptions to compensate. If Wall Street values a stock at 50 times earnings and the current assumption is 30 times, the analyst would be pressured to revise this assumption higher.

There is an old Wall Street adage:

The value of any asset (stock) is only what someone is willing to pay for it (current price).

Wall Street Adage

Just as stock prices fluctuate, so too do growth and multiplier assumptions. Are we to believe Wall Street and the stock price or the analyst and market assumptions? It used to be that free cash flow or earnings were used with a multiplier to arrive at a fair value. In 1999, the S&P 500 typically sold for 28 times free cash flow. However, because so many companies were and are losing money, it has become popular to value a business as a multiple of its revenues. This would seem to be OK, except that the multiple was higher than the PE of many stocks! Some companies were considered bargains at 30 times revenues.

To conclude, fundamental analysis can be valuable, but it should be approached with caution. If you are reading research written by a sell-side analyst, it is important to be familiar with the analyst behind the report. We all have personal biases, and every analyst has some sort of bias. There is nothing wrong with this, and the research can still be of great value. Learn what the ratings mean and the track record of an analyst before jumping off the deep end.

Corporate statements and press releases offer good information, but they should be read with a healthy degree of skepticism to separate the facts from the spin. Press releases don’t happen by accident; they are an important PR tool for companies. Investors should become skilled readers to weed out the important information and ignore the hype.

Quantitative and Qualitative

You can define fundamental analysis as “researching fundamentals.” This is not much help to an investor who does not know what “fundamentals” are and how to use them. Basically, fundamentals include things like revenue and profit. Fundamentals also include everything from the company’s market share to the quality of its management. Fundamental factors are grouped into two categories: quantitative and qualitative.  

Quantitative factors are capable of being measured in numerical terms. Quantitative fundamentals are numeric characteristics about a business. The easiest way to identify quantitative data is the financial statements. Revenue, profit and assets can be measured with great precision.

Qualitative factors relate to the quality or character of something, as opposed to size or quantity. Qualitative fundamentals are less tangible factors – things like quality of a company’s board members and key executives, its brand-name recognition, patents or proprietary technology.

Definition:
A stock investing tactic where you purchase the ten DJIA stocks with the highest dividend yield at the start of each year.  At the start of each consecutive year the stock portfolio must be adjusted so that it always holds the 10 highest yielding stocks.
 

More Detail:
The Dogs of Dow investing tactic was drafted in 1972 and has proven to be quite rewarding. Actually, upon the adjustment of the Dog of the Dow, investors portfolios at the onset of each year, placed a price burden upon the stocks involved.


Definition:
With stock charts, you can view as much as 20 years of data or as little as a few minutes with a variety of line styles, color pallets and comparison features such as technical indicators.
 

More Detail:
Many web sites that offer stock charts offer advanced features. Some of these features offer  the ability to plot price, earnings, splits and dividend data against a price trend. There are many types of technical analysis tools to analyze stock price with stock charts.  Some of the more popular technical analysis tools include: MACD, moving averages, average true range, Bollinger Bands, Stochastics and pivot points.  The most popular chart patterns for spotting uptrends include: cup with handle, head and shoulders,  and double bottoms/tops.
Click Here to see all Beginner Stock Trading Articles

Definition:
A stock quote represents the last price at which a seller and a buyer of a stock agreed on a price to make the trade. Because stock prices are determined by a continuous auction process between buyers and sellers, stock prices change frequently as the buyers and sellers change. Prices also change as new information about that company, that industry, or the economy becomes public; this new information then changes buyers and sellers expectations of the stock’s future performance.

Details

Usually when you get a stock quote, you see lots of other information about that company and that stock price. The most important thing to note is the time-stamp that shows you how old the stock quote is. The other important pieces of information a stock quote shows is the day’s high, low and volume, and sometimes the 52-week high and low.

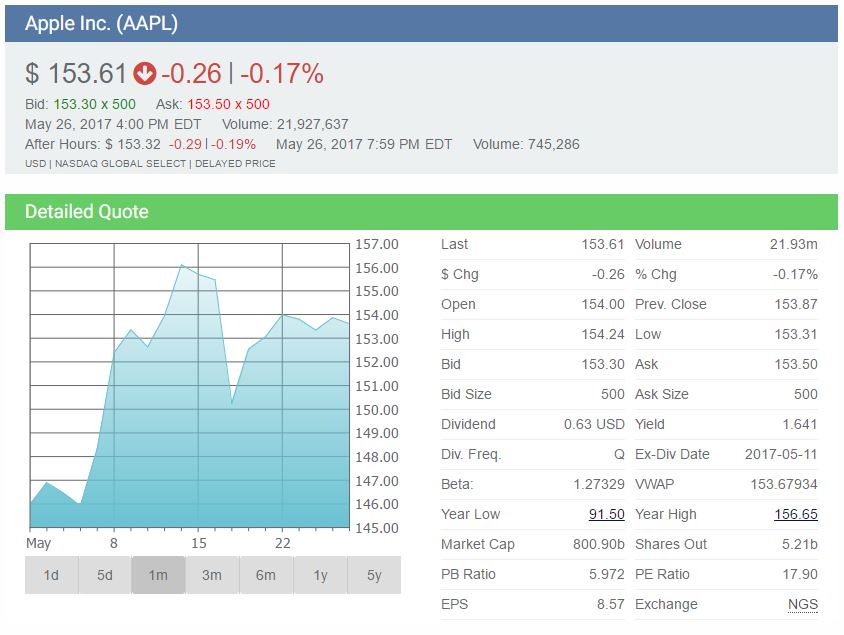
Take a look at the quote of Apple. You will see at the upper right this quote is from 4:00 PM ET on May 26, 2017. The last traded price was 153.61, which is down $0.29 from yesterday’s close, and the day’s trading range is a low of 153.31 and a high of 154.24. IMPORTANT: NOTE THE OPEN PRICE OF $154.00 — STOCKS RARELY OPEN TRADING AT THE SAME PRICE THEY CLOSED AT THE DAY BEFORE.

AAPL Quote

The Stock Chart

After noticing the price and the daily high, low, and volume, take a look at the stock chart.  The chart above shows the stock chart for the last month.  Also click on the 1 Day, 5 Day, 3 Month and 1 Year links to see those charts.  It is always important to get a sense not only of what the stock price is doing today, but to also look for the short and longer term trends.

The Dividend Rate, Dividend Yield, and Ex-Div Date

Companies that are consistently profitable often pay out part of their earnings to shareholders.  This is called a dividend.  In the image above, Apple pays out $0.63 per share per quarter. The Dividend Yield is the percentage of the stock’s price that is paid out in dividends per year, so we can calculate that the $0.63 quarterly dividend is $2.52 annually.  When the stock is at $153.61 then getting that payment of $2.52 is a 1.641% dividend yield.  The Ex-Div Date is the date the last payment was based on.  You had to be a shareholder at the close of business the previous day to get that dividend.  Most companies pay dividends quarterly but list the annual amount.

Bid and Ask Price

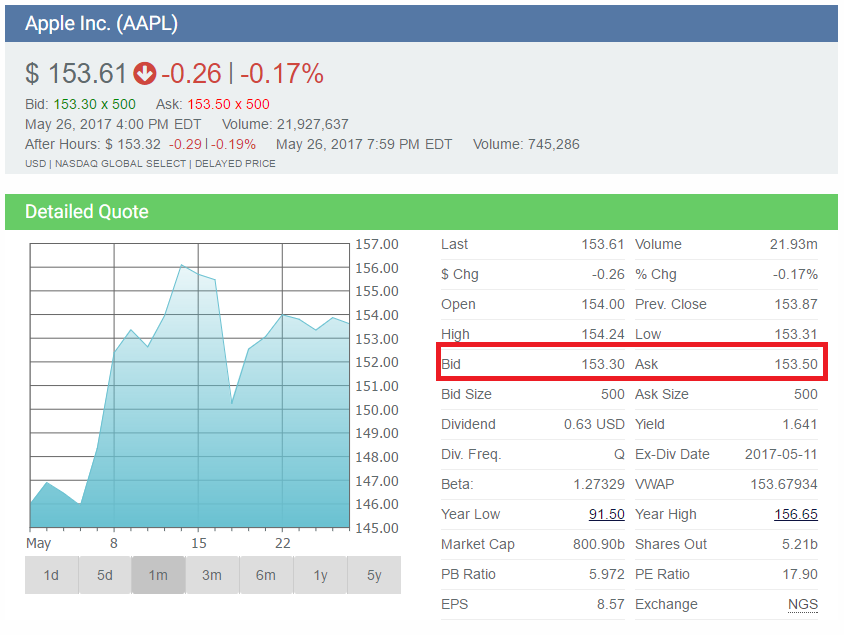
When looking at a stock quote, also notice the Bid Price and the Ask Price if they are shown.  The Bid Price is the highest price a buyer is willing to pay for the stock; the Ask Price is the lowest price a seller is willing to sell the stock.  If you place a Market Order to buy the stock,  your order will get executed closer to the Ask Price.  If you place a Market Order to sell the stock, your order will get executed closer to the Bid Price.

Bid Ask prices

Prices shown are often delayed 15 minutes because of stock exchange rules.

Pricing Increments

Stock prices used to be quoted in fractions like “$116 and a half”, or “53 and 3/4” with the lowest increment of an 1/8th of a dollar (which is 12.5 cents). But now most exchanges only use decimals and allow stock prices to be quoted in pennies (and sometimes 1/10 of a penny).  Stock quotes can either be in real-time or with a specified delay (like a 15-minute delay).

Stock Quote Components

Financial papers, web sites or newsletters have stock quotes that include the following information:

52-Week High and Low – These are the high and low prices a stock was traded over the prior 52 weeks (one year period).

Company Name and Type of Stock – This column provides the name of the stock’s company. If the name does not have special symbols or letters, it is common stock. Different special symbols imply different classes of shares. For example, “pf” would mean that the shares are a preferred stock.

Ticker Symbol – A stock symbol or ticker symbol is an abbreviation used to uniquely identify publicly traded shares of a specific company’s stock on a particular stock market/exchange. A stock symbol may consist of letters, numbers or a combination of both.

Dividend Per Share – This indicates the amount of money that a company pays per share. If it is blank, the company does not pay dividends to its stock holders.

Dividend Yield – The percentage return to the stock owners in dividend per year. You can calculate it by dividing the annual dividends per share by the price per share.

Price/Earnings Ratio – You can calculate this by dividing the stock price by current earnings per share from the last year. This is also called a P/E Ratio.

Trading Volume – This is the total number of shares traded for a specific day, listed in hundreds. Of course you can figure the actual number traded by adding “00” to the end of the number.

Day High and Low – This shows the daily highest price and lowest price that someone paid for the stock.

Close – The close is the last trading price when the market closes. If the entire listing is BOLDED, then the price is UP or DOWN more than 5% from the prior day’s closing price.

Net Change – This is the change in value for the stock price since the previous day’s closing price. When you hear that a stock is “up for the day,” it means that the price increased for the day.

Quotes on the Internet
Today most people get their stock quotes from the Internet. You can get a lot more information online than you can get from the newspapers. Many sites like www.HowTheMarketWorks.com now offer historical financial statements, Wall Street analysts’ ratings, SEC filings, and amazing charting capabilities. You can try out the HowTheMarketWorks quotes tool by entering any ticker symbol in the blue box on the right side of this page.

Click here to see all Beginner Stock Trading Articles

If reading this article was an Assignment, get all 3 of these questions right to get credit!

Click "Next Question" to start the quiz!

IPO

Definition:

The initial sale of stock by a private company to the public which turns it into a public company. IPOs are typically offered by smaller, younger companies who are seeking to expand through the infusion of capital from the IPO. It can also be done by large privately owned companies looking to become publicly traded.

Most IPOs use the services of an underwriting firm, which helps it determine the type of security to issue (common or preferred). The underwriting firm also helps select the price and timing for the IPO.

More Detail IPO:

The initial day of trading as well as the near term can see huge swings in price.  For small private investors, this makes IPOs tough to predict and highly risky for small investors. Most companies with an IPOs are going through a transitory growth period, which adds to the  uncertainty regarding their future values.

 Click Here to see all Beginner Stock Trading Articles

There are many research tools available and many of them are free. Of course, there are some very sophisticated tools that come with hefty price tags; however, for most investors all the research they’ll need is free or available for a modest subscription.

Stock Screener

The most basic research tool is the stock screener.  Some of the better ones come as part of subscription package.  Basically, screeners identify stocks that meet the user criteria.   Criteria can include industry type, market cap, sales, dividends, and so forth. The more sophisticated screeners provide more qualifiers. After you specify your qualifiers, the screener identifies the companies that meet your qualifications. If the list of companies is too large, you can run the screener again with more criteria. Sophisticated screeners will run follow up analysis on the set you just generated.

Click Here to see all Beginner Stock Trading Articles


I want to make my first stock trade. How do I find stocks to buy?

That is a very good question.

Finding stocks to buy is easy, but finding GOOD stocks to buy is challenging. Everyone has their own opinion on which stocks to buy and how long to hold them.

The first thing you need to know about trading stocks is that each stock is assigned a Ticker Symbol by the stock exchanges. The Ticker Symbol is a unique combination of 1 to 5 letters the exchanges use to identify stocks. In order to trade stocks on HowTheMarketWorks you must know the ticker symbol of the stock you are thinking of buying. All of the tools here will list the ticker symbols.

Next, when you are thinking of spending real money on stocks, there are several factors to consider when thinking of which stocks to buy:

  • How long can you wait before you might need the money?
  • How much risk can you take?
  • How many stocks do you want to buy initially in your portfolio?

In terms of your HowTheMarketWorks portfolio, here are suggestions to help build a good portfolio:

  • Trade What You Know! Identify 5 to 10 stocks that you are interested in that you actually know something about. Think of where you, your friends, and your family spend money–food, clothes, travel, toys, banks, technology, etc. Where are you spending more money than you used to?
  • Diversify! This means don’t put all of your eggs in the same basket. Find a food company (think Coca-Cola, Pepsi, Kroger, Whole Foods, Proctor and Gamble, McDonalds, Starbucks), a travel company ( think Delta Airlines, Marriott Hotels, Ford, General Motors, BP Gas, Exxon), a bank, a technology company, etc. and make sure you are buying stocks in different industries.
  • Don’t spend all of your money at one time! Stock prices and the overall market move up and down all the time. You don’t want to spend all of your money today only to have the stock market decline 5% this week! You want to buy stocks when they are cheap and you want to to sell them when they are higher in price. If you think you want to buy 200 shares of General Electric (GE), then try buying 100 shares today and 100 shares next week or whenever you see the price decline slightly. In a bull market, this is called buying on the dips!

To help you get other trading ideas, the site is full of links to various resources, but here are the most popular ones:

  • Our Stock Screener allows you to look for stocks based on price, volume, earnings, and industries.
  • To see the most popular stocks that other HowTheMarketWorks users are trading, take a look at these stocks to buy on our Popular Stocks page.
  • To see the largest U.S. companies and their stock symbols, take a look at our Top 500 Stocks
  • And if you are feeling lazy or luck, you can always pick stocks at random with our Throw Darts at Stocks tool.

Price to Earnings Ratio, Risk & Timeline

If you want to be conservative and keep your risk low, you should choose a few stable, blue-chip stocks like GE and hold them for a few years. The downside is that conservative stocks usually don’t gain value very quickly.

On the other hand, if you want to take some risks and try some more volatile stocks you have a chance at making a larger and faster gain. A good example is to buy Google stock.

Some of the riskiest stocks you can buy are Penny Stocks. They can give you the highest return (or loss!) in the shortest amount of time. They are usually not stocks one wants to buy.

Ensure and Increase Your Safety with Diversification

The more stocks you purchase, the more safe you will be in case one stock drops significantly. Experts often recommend 30 to 100 different stocks but that is often not practical to do. Of course, you will probably also make less money because some stocks will go up and some will go down. You will probably also want to buy from a few different industries so that you will be diversified in case one industry goes sour.

Price to Earnings Ratio

Many people like to use a company’s stock P/E Ratio to determine whether it’s a good buy or not.

The Price to Earnings (profit) Ratio can give you an indication of how high a stock’s price is relative to how profitable it is.

The best thing to do is to compare one company’s PE ratio to other companies in the same industry to see how high or low the price is. What can happen is many, many people can trade stock in a good company, which will cause the price to go much higher than it’s really worth.

See an example of stocks to buy now Microsoft’s industry P/E ratios using Yahoo! Finance (scroll to the bottom).

Good Stocks for Long-Term Growth

Basically, you want to buy stocks that will go up in value over time. That may mean that you need to find some that are currently undervalued, using the PE Ratio or something similar. Or, you might look for companies that show potential to grow significantly over the next few years. But you should try to avoid buying stocks that are overpriced just because they are popular at the moment. That can lead to a quick loss! So it’s important to do your homework when looking for the best stocks to buy today.

Buy Stocks for Your Goals

The stocks to buy are the ones that fit your time frame and risk level. The “experts” in the stock market don’t always have your best interests in mind so you may want to consider asking trusted friends and relatives if they know any good stocks to buy instead.

Trade Stock with our free stock simulator!

Stocks to Buy

Buy direct. Some companies offer direct stock purchase plans (DSPPs). Search online or call or write the company whose stock you wish to buy, to inquire whether they offer such a plan, and forward you a copy of their plan’s prospectus, application forms, and other relevant information. Most plans allow you to invest as low as $50 per month, automatically withdrawn from your bank account. Pay close attention especially to the fees involved. A few companies, such as Procter & Gamble (see here), offer no fee investment plans. DSPPs also allow you to reinvest all your dividends automatically. Some companies even give you a discount, such as 5 percent, for dividend reinvestment.

Use an online discount broker. Search for “online discount brokers” on a search engine to find a list of brokers that you can use to buy and sell stocks online. Be sure to compare their fees and see if they have any hidden fees before signing up. Minimizing fees and expenses is key to successful investing. Most discount brokers charge less than $10 commission per trade, regardless the size of the trade. Some brokers may even offer a certain number of free trades, provided you meet certain criteria, so make sure you read carefully before committing to a broker. The best brokers also offer no fee dividend reinvestment, good customer service, and various research tools for customers.

  • Some brokerages have varying levels of services; pick one that is best for you.
  • Send the broker an initial deposit of funds. (Your broker needs this money to purchase your stocks.) The usual minimum is $2000 but can be as little as $500.00. Some online brokers don’t require a deposit at all.
  • Your broker must report your stock trades to the IRS. You will need to fill out the required forms and mail them back to the broker, possibly even before they will allow you to make your first trade. (Your broker will send you the forms.)
  • Select your stock, notifying your broker of the company’s “symbol” (a 1-5-letter code), the price you’re willing to pay per share, the number of shares to buy, and the length of time for which your offer will be valid (e.g. Single day vs. Good till Cancelled). Instead of specifying a price you are willing to pay (call a ‘limit order’), you may also put in order to buy at the market, which means you order is immediately filled at the current ask price for the stock.
  • Alternatively, use a full service broker. A full service broker is similar to a discount broker as discussed above, except that they charge considerably higher fees, and offer investment advice and more research tools. Because full service brokers are paid mostly by commissions, it is in their best interest to encourage you to trade as frequently as possible, even though it may not be in your best interest.

Common Stock
Common stock is, well, common. When people talk about stocks they are usually referring to this type. In fact, the majority of stock is issued is in this form. We basically went over features of common stock in the last section. Common shares represent ownership in a company and a claim (dividends) on a portion of profits. Investors get one vote per share to elect the board members, who oversee the major decisions made by management.

Over the long term, common stock, by means of capital growth, yields higher returns than almost every other investment. This higher return comes at a cost since common stocks entail the most risk. If a company goes bankrupt and liquidates, the common shareholders will not receive money until the creditors, bondholders and preferred shareholders are paid.

Preferred Stock
Preferred stock represents some degree of ownership in a company but usually doesn’t come with the same voting rights. (This may vary depending on the company.) With preferred shares, investors are usually guaranteed a fixed dividend forever. This is different than common stock, which has variable dividends that are never guaranteed. Another advantage is that in the event of liquidation, preferred shareholders are paid off before the common shareholder (but still after debt holders). Preferred stock may also be callable, meaning that the company has the option to purchase the shares from shareholders at anytime for any reason (usually for a premium).Some people consider preferred stock to be more like debt than equity. A good way to think of these kinds of shares is to see them as being in between bonds and common shares.

Different Classes of Stock
Common and preferred are the two main forms of stock; however, it’s also possible for companies to customize different classes of stock in any way they want. The most common reason for this is the company wanting the voting power to remain with a certain group; therefore, different classes of shares are given different voting rights. For example, one class of shares would be held by a select group who are given ten votes per share while a second class would be issued to the majority of investors who are given one vote per share. When there is more than one class of stock, the classes are traditionally designated as Class A and Class B. Berkshire Hathaway (ticker: BRK), has two classes of stock. The different forms are represented by placing the letter behind the ticker symbol in a form like this: “BRKa, BRKb” or “BRK.A, BRK.B”.

Click Here to see all Beginner Stock Trading Articles

The Definition of a Stock

Stocks are shares in ownership of a company. Stocks represents a claim on the company’s assets and earnings. As you increase your holdings of a stock, your ownership stake in the company increases. Whether you say shares, equity, or stock, it all means the same thing.

Being an Owner

Holding a company’s stock means that you are one of the many owners (shareholders) of a company and, as such, you have a claim (albeit usually very small) to everything the company owns. Yes, this means that technically you own a tiny sliver of every piece of furniture, every trademark, and every contract of the company. As an owner, you are entitled to your share of the company’s earnings as well as any voting rights attached to the stock.

what is a stock

A stock is represented by a stock certificate. This is a fancy piece of paper that is proof of your ownership. In today’s computer age, you won’t actually get to see this document because your brokerage keeps these records electronically, which is also known as holding shares “in street name”. This is done to make the shares easier to trade. In the past, when a person wanted to sell his or her shares, that person physically took the certificates down to the brokerage. Now, trading with a click of the mouse or a phone call makes life easier for everybody.

Being a shareholder of a public company does not mean you have a say in the day-to-day running of the business. Instead, one vote per share to elect the board of directors at annual meetings is the extent to which you have a say in the company. For instance, being a Microsoft shareholder doesn’t mean you can call up Bill Gates and tell him how you think the company should be run. In the same line of thinking, being a shareholder of Anheuser Busch doesn’t mean you can walk into the factory and grab a free case of Bud Light! The management of the company is supposed to increase the value of the firm for shareholders. If this doesn’t happen, the shareholders can vote to have the management removed, at least in theory.

In reality, individual investors like you and I don’t own enough shares to have a material influence on the company. It’s really the big boys like large institutional investors and billionaire entrepreneurs who make the decisions. For ordinary shareholders, not being able to manage the company isn’t such a big deal. After all, the idea is that you don’t want to have to work to make money, right? The importance of being a shareholder is that you are entitled to a portion of the company’s profits and have a claim on assets. Profits are sometimes paid out in the form of dividends. The more shares you own, the larger the portion of the profits you get. Your claim on assets is only relevant if a company goes bankrupt. In case of liquidation, you’ll receive what’s left after all the creditors have been paid.

This last point is worth repeating: the importance of stock ownership is your claim on assets and earnings. Without this, the stock wouldn’t be worth the paper it’s printed on.

Another extremely important feature of stock is its limited liability, which means that, as an owner of a stock, you are not personally liable if the company is not able to pay its debts. Other companies such as partnerships are set up so that if the partnership goes bankrupt the creditors can come after the partners (shareholders) personally and sell off their house, car, furniture, etc. Owning stock means that, no matter what, the maximum value you can lose is the value of your investment. Even if a company of which you are a shareholder goes bankrupt, you can never lose your personal assets.

Debt vs. Equity

Why does a company issue stock? Why would the founders share the profits with thousands of people when they could keep profits to themselves? The reason is that at some point every company needs to raise money. To do this, companies can either borrow it from somebody or raise it by selling part of the company, which is known as issuing stock. A company can borrow by taking a loan from a bank or by issuing bonds. Both methods fit under the umbrella of debt financing.

On the other hand, issuing stock is called equity financing. Issuing stock is advantageous for the company because it does not require the company to pay back the money or make interest payments along the way. All that the shareholders get in return for their money is the hope that the shares will someday be worth more than what they paid for them. The first sale of a stock, which is issued by the private company itself, is called the initial public offering (IPO).

It is important that you understand the distinction between a company financing through debt and financing through equity. When you buy a debt investment such as a bond, you are guaranteed the return of your money (the principal) along with promised interest payments. This isn’t the case with an equity investment. By becoming an owner, you assume the risk of the company not being successful – just as a small business owner isn’t guaranteed a return, neither is a shareholder. As an owner, your claim on assets is less than that of creditors. This means that if a company goes bankrupt and liquidates, you, as a shareholder, don’t get any money until the banks and bondholders have been paid out; we call this absolute priority. Shareholders earn a lot if a company is successful, but they also stand to lose their entire investment if the company isn’t successful.

Risk

It must be emphasized that there are no guarantees when it comes to individual stocks. Some companies pay out dividends, but many others do not. And there is no obligation to pay out dividends even for those firms that have traditionally given them. Without dividends, an investor can make money on a stock only through its appreciation in the open market. On the downside, any stock may go bankrupt, in which case your investment is worth nothing. Although risk might sound all negative, there is also a bright side. Taking on greater risk demands a greater return on your investment. This is the reason why stocks have historically outperformed other investments such as bonds or savings accounts. Over the long term, an investment in stocks has historically had an average return of around 10-12%.

Click Here to see all Beginner Stock Trading Articles

trading haltDefinition: A Trading Halt is the temporary suspension of trading of a security for a specific period of time. Trading Halts typically last for an hour, but can extend into days.

Why does it happen?
Trading Halts are generally made by the exchanges.
A stock are halted from trading if
• The respective company is in the process of announcing important news or information that will significantly impact the stock price.
o It prohibits any trader with inside information from benefitting by trading that security before that news is publicly available.
• There is a significant order imbalance between the buyers and sellers of the securities.
o The halt gives the market specialist (market-maker) enough time to clear out the problems caused by this imbalance.

The NASDAQ and other exchanges currently use 11 codes to specify in more detail why trading has been halted for a security.
The “Over The Counter Bulletin Board” (OTCBB) currently uses 5 codes.

Example:
In June 2010, 6 executives of Sundance Resources Ltd, a mining company in Australia, went missing on a flight in West Africa.  Included in the missing were the CEO and the Chairman. This news was sure to cause a sharp decline in stock price as well as create an unfair arbitrage opportunity for people within the organization with access to the news. Hence, the company immediately requested the Australian Stock Exchange for a trading halt on the company’s stock prior to the open of trade on that morning, until they were sure that the news had been properly distributed to the public.

Advantages of Trading Halts:
• Each market participant gets the equal time to be informed about any news announcement
• Any illegal function caused by any traders are removed and brought to the attention of other investors
• Trading Halts do not cause a change in the stock price of firms
• Regulatory trading halts allow other markets (example: BP trades on the LSE and the NYSE) the opportunity to get the necessary information to halt trading of that stock on their own exchanges

Conclusion:
Trading Halts are necessary tools that exchanges utilize in order to restrict individuals with access to insider information from unfairly gaining profits, as well as fixing any abnormal and technical trading issues.


Definition: Time Decay is the inclination for options to decrease in worth as the expiration date draws near. The extent of the time decay is inversely connected to the changeability of that option.  Time Decay, also referenced to as theta, may be measured by watching the rate of decrease in the amount of an option over time.

Why does it happen?
Options have an intrinsic and an extrinsic worth. As time expires and the finish date of the option approaches, the value of the option loses its extrinsic value and gets near to its intrinsic value.

For instance, the worth associated with trading diminishes with time, meanwhile the value associated with the actual difference between the strike price and the underlying stock price becomes more noticeable.

The more often the option is traded, the less is the result of time decay as market forces maintain the extrinsic value. Also a thinly traded option is subject to considerable time decay as the extrinsic value rapidly dissipates due to a lack of demand.

Example:
Take for instance, AAPL stock price stays constant at $335 for 10 days before the options expiration date.

Price of $340 Call Option 10 days before expiration: $1.05
Price of $340 Call Option 5 days before expiration: $0.50
Price of $340 Call Option on day of expiration: $0.00

The intrinsic value of the call option was $0.00 as it was out of the money throughout the 10 days. Because of supply and demand of the option, the extrinsic value gave a price to the option. As the expiration got closer, the price of the option fell short of its extrinsic value and moved towards its intrinsic value.

Long and Short of Time Decay:

Time Decay can be a useful tool for Options Writers (shorts).

If you can estimate with the help of Theta what the rate of decay of an option is, it is possible to make good profits from the difference in the premium received and premium paid at or before expiration.

Generally, time decay begins gathering momentum around 30-60 days before the expiration date of an option.

Contrary to holding options for a long period of time, especially out of the money, one needs to be good at predicting where the price of the underlying stock will close at the date of expiration.

The investor must realize that because of time decay, the price of their option will not move as much as it does the prior day.

Options lose value every day the stock price does not go in the favor of their option.

Conclusion:
Time Decay increases the chance of a loss in option price daily for a long option holder, while decreasing the risk of a price increase for a writer of an option. Time decay is best measured via the Greek, Theta.


Click Here to see all Options Articles


Definition:
The Sharpe Ratio, named after Nobel laureate William F. Sharpe, measures the rate of return in association with the level of risk used to obtain that rate. It’s a particularly useful tool for novice investors to use as a method tracking “luck” versus “smarts.”

Here’s an easy example to help conceptualize how the Sharpe Ratio works in real life. You and your two friends are out for a drink when the topic turns to investing. Friend number one is the play it safe guy who puts his money in Treasury Bonds and hopes for the best. Essentially his investment is as close to risk free as possible (excluding the threat of inflation of course). It’s safe and requires nothing more than automatic payroll deductions to generate a steady – albeit decidedly insignificant – rate of return. This is considered a “risk free” rate. Since anyone can obtain that rate of return by doing almost nothing, it is removed from the equation. Stocks, by their very nature, have some element of risk and as a rule of thumb, any investment with an element of risk should generate a premium above the risk free level…otherwise, why put your money at stake?

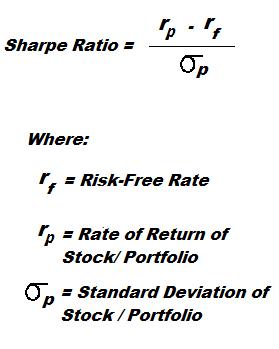
Friend number two is telling you about his hot new investment tip that just generated an amazing 25 percent rate or return. Is this guy a genius or what? Maybe not. By using the Sharpe Ratio, you can measure whether your friend is taking on too much risk. Briefly, it works like this… Subtract the risk free rate (like that available from your friends Treasury bills) from the rate of return generated then divide by the standard deviation of the portfolio returns. The result provides a way to measure the excess return derived from the level of risk assumed…not necessarily insight and intuition. Chances are your friend isn’t a genius but rather a lucky hot-shot who needs to take the money and run before his luck runs out. To give you some insight, a ratio of 1 or better is considered good, 2 and better is very good, and 3 and better is considered excellent. One final note: if your investment portfolio isn’t performing above the risk free rate then it’s time to put up or shut up. Either figure out what you are doing wrong and begin educating yourself on the basics of investing or sign up for those bonds via payroll deduction and hope inflation leaves you a little to live on by retirement.

More Detail: The Sharpe Ratio calculates the difference between risk-free and a risky asset. Then you divide the difference by the Standard Deviation ( the value of risk) of the stock / portfolio.  The Sharpe Ratio is a strategy to maximize the reward to risk relationship.

What does the Sharpe Ratio Mean?

The Sharpe Ratio shows the excess return from the excess risk taken by an investor.

It is a measure which can be used to compare two or more investments to show which one earned the most excess return given the least amount of extra risk.
Two Stocks or Portfolios that generate the same return over a certain period might not be the same in terms of the risk taken to invest in each of them.
One of them might have been more volatile during that period, meaning that our risk for that stock / portfolio was greater.
Example:
Risk –Free Rate (Savings Account at ING Direct) = 3% Stock A = Apple (AAPL)
3-Month Return = 22%
Standard Deviation = 1%
Sharpe Ratio for AAPL = (0.22 – 0.03)/(0.01) = 19 Stock B = Google (GOOG)
3-Month Return = 24%
Standard Deviation = 2%
Sharpe Ratio for GOOG = (0.24 – 0.03)/(0.02) = 10.5
Results:
(i) Since both stocks had Sharpe Ratios greater than Zero, It was better to invest in one of them than to save the money at ING at 2%.
(ii) Even though GOOG had a slightly higher return that AAPL (24% > 22%), it would have been wiser to invest in AAPL as AAPL had a higher excess return per unit of risk than GOOG (19 > 10.5).

Practice this on HTMW

You can calculate your own Sharpe Ratio on stocks after trading it on:

Free Stock Market Game For Students

Limitations of Sharpe Ratio
The limitation of the Sharpe Ratio is that it just tells you that one investment was better than the other comparing risk, but does not tell you HOW MUCH better that investment was. In other words, there are no units to measure the added benefit from choosing one investment over another.

Conclusion

Sharpe Ratio

The Sharpe Ratio is a useful tool to evaluate the actual risk-adjusted performance of a stock or portfolio compared to another. It shows us which investment is better if we want to maximize our returns while minimizing our risk.

Click Here for instructions on calculating the Sharpe Ratio for your portfolio yourself in Excel


Click Here to see all Advanced Stock Trading Articles


There are  many stock market myths.  Here are a few of our favorites that you might like to add to the collection:

Fallen Angels Rise
Many people  like the idea of buying at the 52 week low as it  leaves nowhere to go but up. Unfortunately, this myth of buying on price is a recipe for disaster.  Many professional investors call this catching a falling knife.  It is always possible for a stock’s price to continue to fall.  Always look for value.  Most professionals would prefer to buy at a new high than a new low.

What Goes Up Must Come Down
Lets look at a well known example.  Was Berkshire Hathaway (BRKb) expensive at $6,000 per share? How about at $10,000 per share? Who could have ever imagined that this stock would exceed $70,000 per share?  Inflationary alone would help stocks continued upward momentum.

Stock Market Investing is the same as Gambling
Many people go to Los Vegas and say that they are investing and get a higher return with craps than the stock market.  In fact, this really depends on the strategy you use.  If you listen to rumors and TV investment shows, the chance are that Vegas would be a better bet. On the other hand, vast fortunes have been made by those who use thoughtful investment strategies..

It requires advance training and college degrees.
Nothing could be further from the truth. It is equally easy for people using online resources and research as with college education.  The best approach is using virtual trading to test strategies till you find a method that works.

You get what you pay for
There are 100s of investment strategists and salesmen that will try to tell you that you “get what you pay for” in the stock market.  That if you pay higher fees for their advise, you will get better returns.  Statistics show that eliminating the middle man significantly increases the rate of return for many investors. Understand what you are paying for and then decide if it is really worth it.

Pay-for-Performance.
Mutual fund companies charge high fees before you know what kind of return they are going to provide. Don’t pay to play if the mutual fund doesn’t perform.  It is better to use no fee mutual funds or ETFs to achieve the same financial goals.


Portfolio Management teaches that investors need to include input of the following personal issues and is key to select your trading strategy:

  • personality,
  • goals,
  • amount of investment capital,
  • comfort zone.

Select Your Trading Strategy

Investors that enjoy a lot of in an out higher risk action should look into day trading for their style of investing.

Others, with long-term goals and objectives, will look into a trade and hold approach to trading.

Regardless of your method of trading, these factors contribute to the creation of most porttfolios:

  • Diversify your portfolio: To create a successful portfolio or win your stock market game, diversify your portfolio with different investments from a variety of industries.
  • Keep your eyes on profit: Whether looking for short-term gains or long-term growth, profits is king.
  • Evaluate key ratios: Learn the most important numbers (book value, return on equity (ROE), earnings per share (EPS), and net income) of all your portfolio assets.
  • Stay true to your investment strategy: Use your strategy as your roadmap or game plan.
  • Minimize mistakes and risks: You should avoid errors and undue risk at all costs to maximize profit..

There has been a lot of talk in the media (including from me) about the effects, both positive and negative, of the Fed’s aggressive monetary easing programs .

We are in the camp that believes Fed’s support was unquestionably needed during the throes of the crisis in order to avoid a complete financial collapse.

However, the continued aggressive monetary support from the Fed has led to some serious concerns, at least on our part.

Our major concerns, as we have articulated in past market commentaries, are that 1) the Fed’s actions can cause commodity price inflation, which can be counterproductive to the recovery; 2) the Fed’s policies can cause asset price inflation, leading to the threat of asset bubbles; and 3) both the economy and capital markets have become heavily dependent on continued aggressive Fed actions, potentially creating a problem of moral hazard (particularly in the stock market).

Our overriding fear is that the Fed will find it very difficult to extricate itself from the situation of dependence it has created. And while stabilization in housing prices and huge gains in stocks feel good at the moment, this could all change very quickly. The Fed cannot simply manipulate interest rates and grow its balance sheet indefinitely. What is the exit strategy? When does it begin?

In an effort to better understand the effects of the Fed’s monetary policy, we constructed a timeline of major Fed developments and tracked key economic metrics. We tracked five metrics or indices:

the Dollar Index [DXC1  79.965    0.375  (+0.47%)]
the price of oil [LCOCV1  111.97    -0.04  (-0.04%)]

a commodity index
, the S&P 500 [.SPX  1442.74    -4.41  (-0.3%)]
the 10-year Treasury note [TYCV1  133.5469    0.0469  (+0.04%)]

Our starting point was the announcement date of the Fed’s first quantitative easing program (“QE1”), and our ending point was late February of this year. The rather busy chart below shows the results of our analysis. The boxed annotations represent key developments at the Fed. The shaded gray areas on the chart represent periods during which the Fed had withdrawn QE support only to return later with more QE. Take a minute to review the chart, and we will try to draw some conclusions below.

Some conclusions seem pretty clear from the table (even though correlation is not necessarily causality):

  1. The ballooning of the Fed’s balance sheet has contributed to a 17% decline in the value of the dollar versus a basket of other currencies;
  2. The QE programs seem to have, at the very least, contributed to the sharp increases in commodity prices;
  3. QE has been very kind to stock investors, and stocks performed far better during periods of QE support as compared to during periods which the Fed had withdrawn its QE support (gray shaded areas);
  4. The sharp drop in yield on the 10-year Treasury note (down 41% during the measurement period, which is the objective of QE) occurred entirely during periods of withdrawn QE support.

The first three conclusions are consistent with our worries articulated above – the Fed’s programs seem to have at least contributed to both commodity and asset price inflation, and the stock market, at least, seems to be highly dependent on Fed support.

The last conclusion, however, is potentially more worrisome.

The fact that interest rates plummeted during periods of withdrawn QE support may be telling us that the economy is not strong enough to stand on its own two feet. Given that many people regard the bond market as better “tea leaves” than the stock market, it should come as no surprise that Bernanke remains fully committed to his aggressive monetary stimulus initiatives.

The problem is that there is no way to definitively know whether it is yet safe to take of the training wheels. Each time the Fed has withdrawn to date, the economic outlook appeared to deteriorate significantly. This has left Bernanke in a state of fear, believing he needs to stay fully engaged. However, it is quite possible that another factor was responsible. The crisis in Europe created an inordinate amount of uncertainty and pessimism during the summer of last year. To the extent that the liquidity crisis has eased, might this provide Bernanke with an opportunity to reduce the pressure on the accelerator?

In my opinion, we are rapidly approaching the moment whereby the risks of continued monetary support may outweigh the benefits. Several Fed governors, including Charlie Plosser, Jeffrey Lacker and Richard Fisher, seem to already agree with me. These Fed officials seem to understand that the longer we wait, the harder it will be to unwind. We hope that Bernanke will soon catch on as well.

Definition: Capital Asset Pricing Model (CAPM) is a method used to rate  stocks given their limited cash. 

More Detail: The CAPM estimates potential rate of return on a stock given the stock’s level of risk.

 It is easy to know the rate of return for savings account or a bond (Example: 3% Savings Account or 6% Coupon Bond).  But how to you figure the rate of return on a stock before you buy it?

For example, if you wanted to buy Apple stock (AAPL), there is no label that says, “AAPL Return = 15% per year”.

One of the methods to estimate a stock’s rate of return is using the Capital Asset Pricing Model (CAPM)

 Formula

   R(a) = R(f) + β [R(m) – R(f)]

Where:

                                        R(a) = Expected rate of return on the stock, portfolio

                                        R(f) = Risk free rate

                                        β = beta of security/systematic risk

                                        R(m) = expected market return


What does it mean?

 It is a model that estimates the relationship between risk and expected return. The first part of the formula R(f) is the rate investors get if they were going to invest money risk-free.

The second part β [R(m) – R(f)] is a Beta factor (risk) for investors for accepting risk and investing in that particular security.

According to the model, you can use the CAPM to calculate rate of return.  This expected return is compared with the required rate of return for the investor. If the model shows the potential rate of return is greater than the investor’s required rate of return then the investor should invest in the stock.  But if CAPM shows a lower rate of return than expected by the investor, then the investor should not buy that security

Example

Expected return on Apple (AAPL) stock for 1 year can be calculated using the CAPM model

To get the market return we consider the S&P500 = R(m)

1 year average return on S&P 500 = R(m) = 14%

Risk Free Rate (Savings Account at ING Direct) = R(f) = 2%

Beta of Apple stock = β = 1.35

Using CAPM;

R(a) = R(f) + β[R(m) – R(f)]

R(a) = 0.02 + 1.35[0.14 – 0.02]

R(a) = 18.20%

Results:  The expected return on the Apple stock is 18.20%

Practice this on HTMW

You can practice trading for real on HTMW based on CAPM by:

(a)  Finding the desired holding period risk free rate

(b)  Finding the Stock’s Beta (Google Finance has an estimate of Beta on most stocks)

(c)  Taking an average of the S&P 500 historical prices for the desired time –period you want to hold the stock

(d)  Calculating the CAPM from the formula

(e)  And finally, seeing if CAPM holds by trading and holding the stock using the HTMW Virtual Trading Platform.

 Conclusion

CAPM is a useful tool to find the expected return of a stock or portfolio. The model depends upon how much risk there is. Hence if we know the value of the Beta, which is a measure of risk, the approximate expected return of the stock can be easily calculated using the CAPM formula.


Click Here to see all Advanced Stock Trading Articles


Definition: The most basic form of short selling is where you sell stock that you borrow from an owner and do not own. You have delivered the borrowed shares. Another form of short selling is whe  you do not own the stock and do not borrow them from someone else. In this type of transaction,  you owe the shorted shares but “fail to deliver them to the owner.”

Explation: These naked short sales are typically done by market makers because they tentatively need to in order to maintain liquidity in the options markets. These options market makers are often brokers of large hedge funds, who abuse the options market maker exemption.


Click Here to see all Advanced Stock Trading Articles


Definition: The cash received from the short sale of a security. The interest return from investment of the short proceeds is usually divided between the short seller, who gets partial “use of proceeds,” and the securities lender.

Definition: A “stock order term” The time period over which an order/trade remains open (today, till you cancel it or till a specific date).

Explanation and Examples: Stock ABC is currently trading at $101. You see that the stock is gyrating around 100 so you choose to put a LIMIT order at 100. At this point, the Order Term box opens so that you can specify how long you want this order to stay in effect. You decide that you only want this order to execute today or not at all. If the price hits $100 today, the transaction will execute and you will own the stock. Otherwise, the order will be canceled.  Remember, you will never use Order Term for market orders — buying at the current price — only for limit order, stop orders or trailing stop order