Definition:

Short selling or Selling Short is the act of borrowing a security from someone else, usually a broker, selling it and later repurchasing the stock in the hopes that it will be cheaper.

Explanation:

In simple terms opening a short position (or going short, shorting) is used when you think an asset will decrease in price. Short sales require a margin account and have strict margin requirements, so they may not be available to investors with less than $25,000 or so to invest. Part of this is because you are borrowing something that isn’t yours but also because, in theory, the loss can be infinite. When you buy a stock normally, the most you can lose is your purchasing price.

When you are shorting a stock, however, things are a bit more different. If you short a penny stock trading at $0.05, thinking it will go down to $0.01, but instead the company has a breakthrough and the price takes off, your loss can be far more than you were prepared to invest. To close a short, a cover order is used to buy the share you borrowed and essentially give back the share you had borrowed.

Example of Selling Short:

Let’s assume you think stock ABC is going to go from $35 to $30. So you call your broker and decide to short it. You then put money in your margin account which will be added with $35 for the borrowed sale of ABC (or less, sometimes some of the margin is frozen and kept by the broker for trading fees, etc.). You then notice that the price has gone from $35 to $45. The broker than calls you to put more money in your margin account, you decide not to and buy the shares for $45 to give back your borrowed shares. You have then incurred a loss of $10 per share plus the commission fees.

On the other hand, if the price did fall to $30, you could then “cover” your short by buying the shares for cheaper than you sold them, returning the shares to the broker, and keeping the $5 per share difference (minus commissions).

Definition: Buying on margin is borrowing money from a broker to purchase stock.

Example: Margin trading allows you to buy more stock than you’d be able to normally. To trade on margin, you need a margin account. This is different from a regular cash account, in which you trade using the money in the account. By law, your broker is required to obtain your signature to open a margin account. The margin account may be part of your standard account opening agreement or may be a completely separate agreement. An initial investment of at least $2,000 is required for a margin account, though some brokerages require more. This deposit is known as the minimum margin. Once the account is opened and operational, you can borrow up to 50% of the purchase price of a stock. This portion of the purchase price that you deposit is known as the initial margin. It’s essential to know that you don’t have to margin all the way up to 50%. You can borrow less, say 10% or 25%. Be aware that some brokerages require you to deposit more than 50% of the purchase price.


Diversification

Definition:
Diversification is a widely used strategy for investors who want to minimize risk to a certain degree. Diversification simply means spreading your investments over different market vehicles. Just like your mother or grandmother who told you not to put all your eggs in one basket, Diversification is intelligently spreading your assets around in order to reduce risk. This in turn spreads your risk and if one industry gives you a loss, the other might make you profitable.

For example, investing $10,000 in the stock market in the technology sector is not diversification. Alternatively, investing 50% of that in the technology sector and the other 50% in the health care sector will diversify your portfolio, but not highly. A good example of a diversified portfolio is a Mutual Fund which usually takes your money, places 70% of it in stocks (different stocks/industries), 20% in other types of investments such as bonds, and the remaining 10% in cash. Another way to achieve Diversification is by spreading out investments around the globe. Many investors will keep the bulk of their assets in North America, but also invest in emerging markets like China, India and Brazil. That way, they are protected against big losses in any one market and can get exposure to quickly growing new markets. Finally, Diversification can be achieved by market capitalization(cap). Large cap stocks fill the majority of a portfolio while mid-cap stocks and small cap stocks make up the remainder. This way, a portfolio can enjoy the protection of having stocks of all different sizes.

Further Explanation:
Further diversification can be obtained by investing in stocks from different countries, and in different asset classes such as bonds, real estate, private equity, infrastructure and commodities such as heating oil or gold.

Since the mid-1970s, it has also been argued that geographic diversification would generate superior risk-adjusted returns for large institutional investors by reducing overall portfolio risk while capturing some of the higher rates of return offered by the emerging markets of Asia and Latin America.

Definition: A ratio of the cash generated divided by the number of outstanding shares.

In Depth Description:
A measure of a firm’s financial strength, calculated as:

Cash Flow Per Share = (Operating Cash Flow – Preferred Dividends) / Common Shares Outstanding.

Cash flow per share shows the after-tax earnings plus depreciation, on a per share basis. Many financial analysts place more emphasis on the cash flow per share value than on earnings per share values. While an earnings per share value can be easily manipulated to appear more positive than it really is, therefore putting its reliability in question, cash is more difficult to alter, resulting in what some analysts believe is a more accurate value of the strength and sustainability of a particular business model.


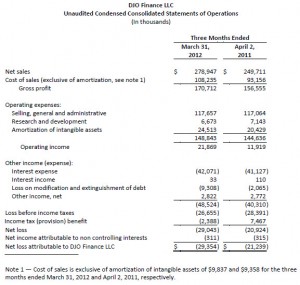
Form 10QDefinition: Form 10-Q, is also known as a 10-Q or 10Q, is a quarterly report mandated by the United States federal Securities and Exchange Commission, to be filed by publicly traded corporations.

Explation: Pursuant to Section 13 or 15(d) of the Securities Exchange Act of 1934, it’s an SEC filing that must be filed quarterly with the US Securities and Exchange Commission. It contains similar information to the annual form 10-K, however the information is generally less detailed, and the financial statements are generally unaudited. Information for the final quarter of a firm’s fiscal year is included in the 10-K, so only three 10-Q filings are made each year.

These reports generally compare last quarter to the current quarter and last years quarter to this years quarter. The SEC put this form in place to facilitate better informed investors. The form 10-Q must be filed within 40 days for large accelerated filers and accelerated filers or 45 days after the end of the fiscal quarter for all other registrants (formerly 45 days).

A company’s earnings per share is the portion of a company’s profit that is allocated to each outstanding share of common stock, and, like cash flow per share, serves as an indicator of a company’s profitability. Because the cash flow per share takes into consideration a company’s ability to generate cash, it is regarded by some analysts as a more accurate measure of a company’s financial situation than the earnings per share metric. Cash flow per share represents the net cash a firm produces, on a per share basis.


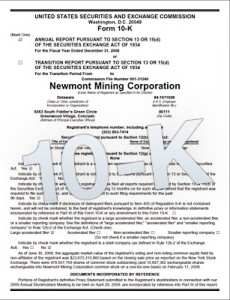
10-k formDefinition: The 10-K form is an annual report required by the U.S. Securities and Exchange Commission (SEC), that gives a comprehensive summary of a public company’s performance. Although similarly named, the annual report on Form 10-K is distinct from the often glossy “annual report to shareholders,” which a company must send to its shareholders when it holds an annual meeting to elect directors (though some companies combine the annual report and the 10-K into one document). The 10-K includes information such as company history, organizational structure, executive compensation, equity, subsidiaries, and audited financial statements, among other information.

Explation: Companies with more than $10 million in assets and a class of equity securities that is held by more than 500 owners must file annual and other periodic reports, regardless of whether the securities are publicly or privately traded. Up until March 16, 2009, smaller companies could use Form 10-KSB. If a shareholder requests a company’s Form 10-K, the company must provide a copy. In addition, most large companies must disclose on Form 10-K whether the company makes its periodic and current reports available, free of charge, on its website. Form 10-K, as well as other SEC filings may be searched at the EDGAR database on the SEC’s website.

In addition to the 10-K, which is filed annually, a company is also required to file quarterly reports on Form 10-Q. Information for the final quarter of a firm’s fiscal year is included in the annual 10-K, so only three 10-Q filings are made each year. In the period between these filings, and in case of a significant event, such as a CEO departing or bankruptcy, a Form 8-K must be filed in order to provide up to date information.

The name of the Form 10-K comes from the CFR (Code of Federal Regulations) designation of the form pursuant to sections 13 and 15(d) of the Securities Exchange Act of 1934 as amended.
 

What is a Balance Sheet?

The Balance Sheet (or Statement of Financial Position) is one of the four financial statements required by the SEC based on the U.S. GAAP (Generally Accepted Accounting Principles). According to the SEC, the Statement of Financial Position presents “detailed information about a company’s assets, liabilities and shareholders’ equity.” In other words, this statement is a financial snapshot of the firm on a specific date.

Why is the Balance Sheet important?

Understanding the Balance Sheet is very useful in understanding a firm’s financials. The Balance Sheet is important because it resumes what the firm owns and what is owes. More specifically, it presents the firm’s assets, liabilities and the shareholders’ equity. Many types of ratios can also be measured from the balance sheet. Let’s take the debt-to-equity (D/E) ratio as an example. The breakdown of the Debt-to-Equity is the Total Liabilities divided by the Shareholders’ Equity, where both values can be found in the balance sheet. This ratio is very important because it measures how much debt the firm has with respect to the amount provided by the shareholders. Thus, for management, investors and creditors, it will be essential to review the balance sheet to ensure that the business is financially stable.

Who is interested in the Balance Sheet?

There are many players who are interested in the Balance sheet:

  • Investors
    • Current and future investors will review the Balance Sheet to view the company’s financial position and use it to evaluate its solvency, liquidity and capital structure using financial ratios.
  • Lenders/Creditors
    • Lenders and creditors will investigate the Balance Sheet to define the firm’s liquidity to conclude if it is able to meet their payment requirements and obligations, should the firm seek more funding.
  • Management
    • Managers can keep track of the company’s financial standpoint over time and be able to make strategic decisions for growth and prevent bankruptcy.

What does a Balance Sheet look like? What are the components?

In a balance sheet, there are three main components with sub-components. Whether you are building a balance sheet or working on an accounting exercise, the golden rule of a balance sheet is that at the end, the following equation must equate: Assets = Liabilities + Shareholders’ Equity. It is also important to note that the balance sheet is listed by liquidity per category. We will briefly review all three main components of this statement:

  1. Assets are what the company owns and uses for its operations. It includes tangible and intangible assets. The assets of a company can be divided in two sub-categories:
    • Current Assets are assets that can be converted into cash within a period of one year or less. These assets are very liquid and can help investors define how much of liquid assets the company owns.
    • Non-Current Assets are assets that cannot be converted within a period of one year. This category includes fixed assets such as properties, plants and equipment used for production.
  2. Liabilities are what the company owes and need to pay to complete their obligations. The liabilities of a company can be divided in two sub-categories:
    • Current Liabilities are obligations that needs to be fulfilled within a year. As an example, the salaries payable account contains all the salaries that needs to be paid to employees of the firm.
    • Non-Current Liabilities are obligations that needs to be fulfilled after one year. For example, a long-term Bank loan is a financial obligation where the issuer will be paid back at a time that is higher than one year.
  3. Shareholders’ Equity is what the company’s investors contributed to the company. It also includes earnings and dividends issued to shareholders.

Where can I find the Balance Sheet for a specific company?

Getting Balance Sheets On HowTheMarketWorks

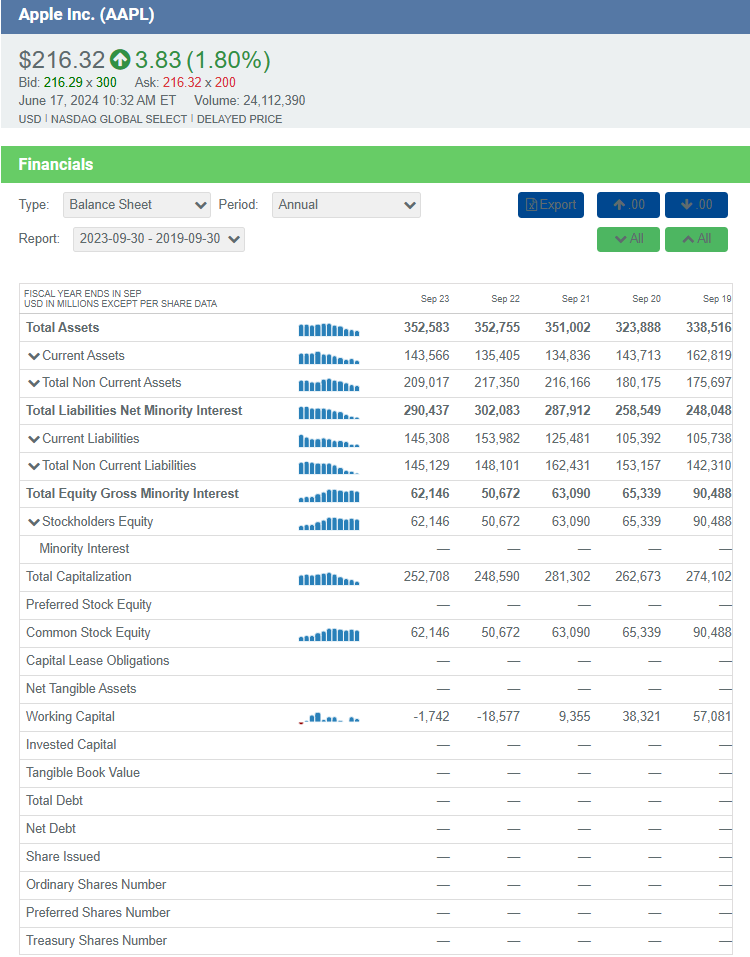
You can find the balance sheets of every publicly traded company in the United States using HowTheMarketWorks’ Quotes tool.

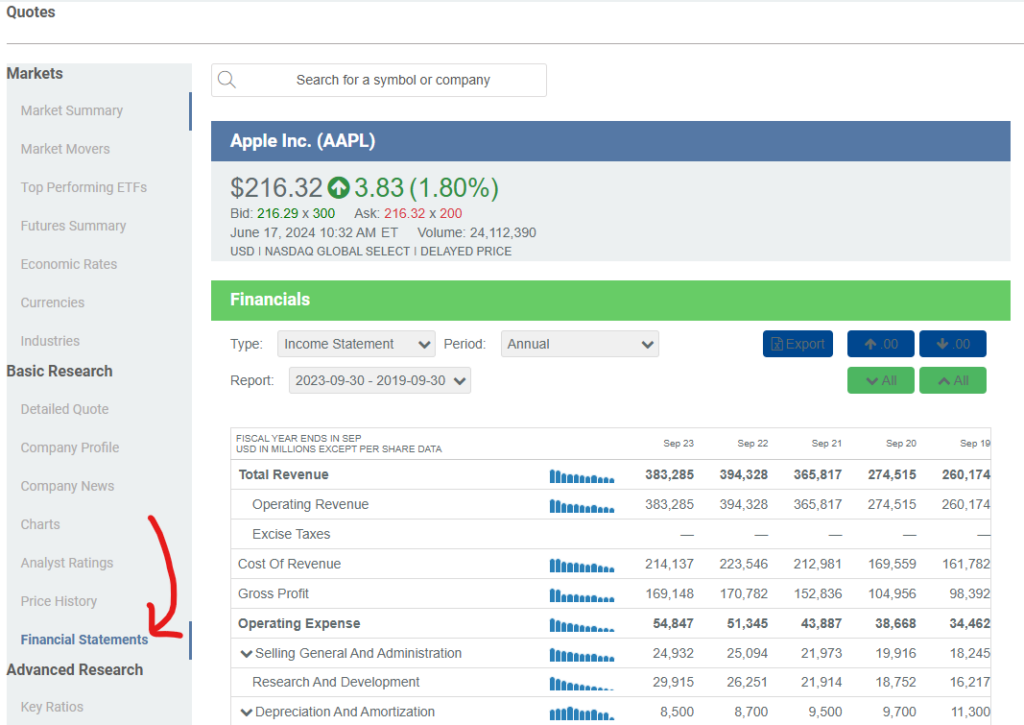
Just open the quotes page, and search for the symbol you want to find (for example, AAPL). Next, click “Financials” on the left side menu.

The balance sheet will load below (you can also use this page to find the income statements). You can compare the most recent balance sheet with several of the previous years to get a sense of what direction the company has been heading.

A company’s balance sheet provides investors the ability to compare the current balance sheet to previous editions. They can see when a company is improving current assets relative to those reported a year ago.
Often companies display this period’s balance sheet line items along site prior year’s balance sheets. The income statement is the first piece of information many investors look at when they are thinking about investing in a company.

Pop Quiz!

If reading this article was an Assignment, get all of these questions right to get credit!

Click "Next Question" to start the quiz!

Definition

The Income Statement is one of the financial statements that all publicly traded companies share with their investors. The income statement shows the company’s sales, expenses, and net profit (or loss) over a period of time–usually 3 months, year-to-date, and twelve months. The income statement also comes with a lot of notes and discussions from the company’s management so that investors can have a clear understanding of the company’s performance. The other two components to the financial statements are the Balance Sheet and the Statement of Cash Flows.

Explanation

Income statement (also referred to as profit and loss statement (P&L), revenue statement, statement of financial performance, earnings statement, operating statement or statement of operations) is a company’s financial statement that show whether or not the company is making a profit. The income statement shows, for a stated period of time, the total amount of revenue from the sale of products or services, the total expenses involved in running the business, and finally the net profit or loss. The income statement serves 2 main purposes: it shows managers how their part of the business is performing and whether they are keeping to a budget, and it shows investors the overall performance of the company. The important thing to remember about an income statement is that it represents a period of time. This contrasts with the balance sheet, which represents a single moment in time.

The portion of the income statement that deals with operating items is interesting to investors and analysts alike because this section discloses information about revenues and expenses that are a direct result of the regular business operations. For example, if a business creates sports equipment, then the operating items section would talk about the revenues and expenses involved with the production of sports equipment. The term “bottom line” refers to the net income of the company because when you look at an income statement, the bottom line is usually net income.

The non-operating items section discloses revenue and expense information about activities that are not tied directly to a company’s regular operations. For example, if the sport equipment company sold a factory and some old plant equipment, then this information would be in the non-operating items section.

Steps in Understandings the Income Statement Sheet

In order to best understand how to read and understand an Income Statement Sheet, it’s important to understand the order of which information is displayed.

  1. Date: At the top of the Income Statement is the date that the statement was created and reflects all data up to that point. The Income Statement will read “For the period ending xxx”
  2. Net Sales: represents the total amount of income received from customers paying for the company’s goods and services.
  3. Cost of Sales (also known as Cost of Goods Sold): is the amount of money the company has spent in the production of its goods. Raw materials, labor, manufacturing overhead are included in this figure.
  4. Gross Profit or Margin: represents the profit a company has earned only after taking into account the Cost of Sales (#3)
  5. Operating Expenses: This figure represents the amount spent on operational expenses, and is normally broken down in to two figures: (i) Research and development (ii) Selling, general and administrative.
  6. Operating Income: This figure represents earnings from normal operations without taking in to consideration taxes and special one time occurring items (e.g.: settlement of a court case.)
  7. Interest Expense: This figure reflects the cost of borrowing money.
  8. Pre-tax Income: This figure represents total earnings not including taxes. This may also be labeled Income before provisions for income taxes.
  9. Income Taxes: The income tax amount is an estimate as taxes are normally paid once a year, while Income Statements are released four times a year. This figure best represents what taxes the company expects to pay and may also appear on an income statement as Provision for income taxes.
  10. Special or Extraordinary Expenses: This figure represents “special” expenses, which do not normally occur on a continued basis. For example, the purchase of a new warehouse is not a regular occurrence.
  11. Net Income: This figure represents the residual income after adding total revenues and subtracting this figure with all expenses.

Example of Income Statement

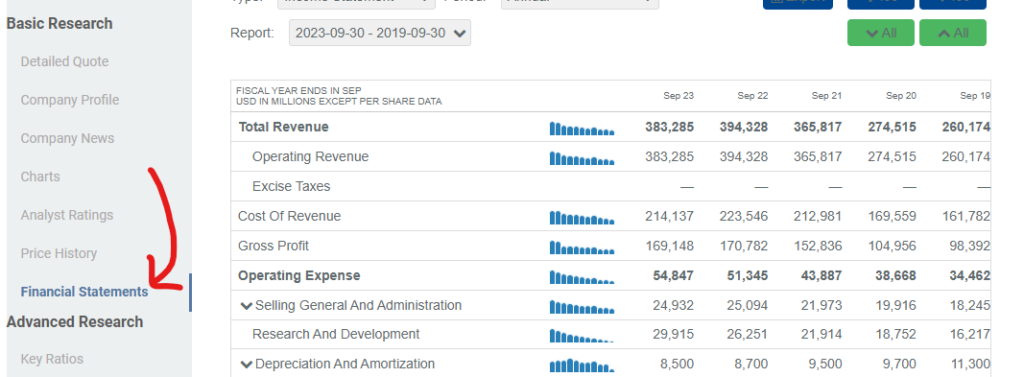
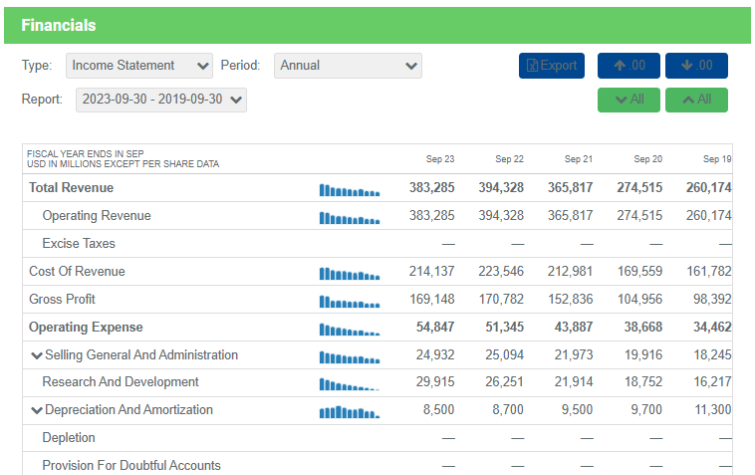
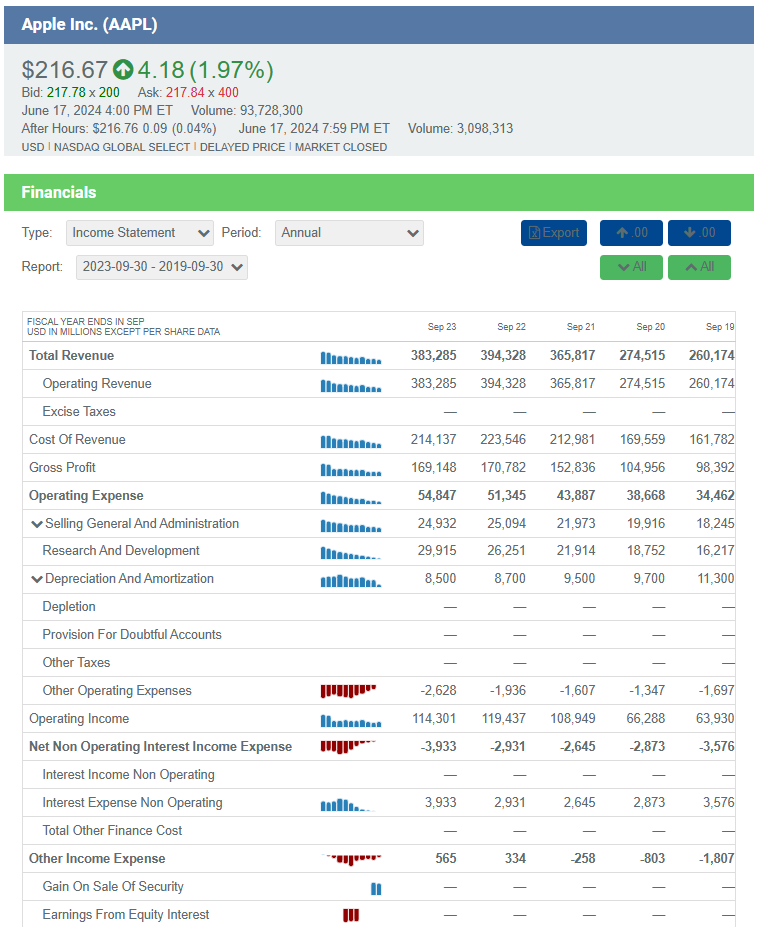
When you get a stock quote on the HowTheMarketWorks site, you can also view the company’s financial statement. Below is Apple’s Income Statement as of September 2023 (NOTE: In the upper left corner it says all numbers are in MILLIONS):

Note how the Income Statement flows in the same order as listed above.

Finding A Company’s Balance Sheet On HowTheMarketWorks

You can find the balance sheet of every company trading on a major US, Canadian, or even many international exchanges on HowTheMarketWorks.

First, go to the Quotes page.

From here, look up any company’s ticker symbol that you are interested in, then select “Financials” from the left side panel.

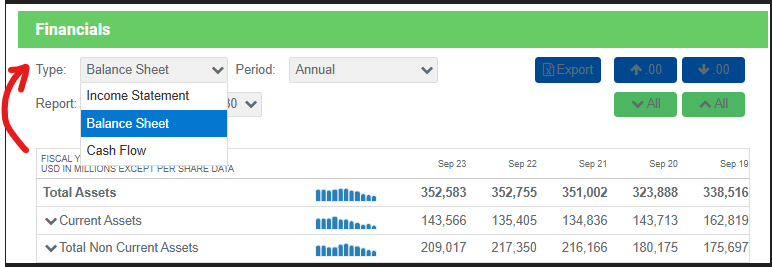
From here, you can use the drop-down menu to switch between their most recent income statement, cash flow summary, or balance sheet.

Conclusion

Investors pay close attention to an Income Statement because it is an accurate snapshot of a company’s performance over a specific time period.

Lenders also evaluate the suitability of a loan based on the Income Statement.

The Income Statement is a direct result of all financial information incurred during the time period and is transformed into easy to understand figures.

Comparing Income Statements to those in the past periods is a great indication of the direction a company is heading in.

Investors pay close attention to the “bottom line” Net Income and expect this figure to increase on a consistent basis over time. The “bottom line” figure is often the first set of data an investor looks at before determining its suitability for investment.

An increasing Net Income over time can be indicative that the company is heading in the right direction, while a decreasing Net Income can reveal the opposite.

For more financial statements, read our article on balance sheets

Definition:
Just like the Limit Order, this is another form of trade with a different set of limitations. A Stop Loss Sell order is a conditional sell order that will only execute if the price of the stock reaches a target price (set by the seller) or lower.  For example, say you bought Apple at $100 and they are currently trading at $104. I could set a Stop Loss order at $101. This means that once the price of Apple starts to dip and hits $101, my order becomes an order to sell. This should limit any losses I could take on my profits.  If it sells at $101, then I still made a profit of $1 per share.

Explantion:
Setting a stop-loss order for 10% below the price you paid for the stock will limit your loss to 10%. This strategy allows investors to determine their loss limit in advance, preventing emotional decision-making. It’s also a great idea to use a stop order before you leave for holidays or enter a situation in which you will be unable to watch your stocks for an extended period of time.

According to the SEC, a stop order “is an order to buy or sell a stock once the price of the stock reaches a specified price, known as the stop price.” Whether you are trading on Stock-Trak or your actual brokerage account, stop orders can be very useful and efficient when managing your portfolio. As you may know, there are four actions that can be performed by the trader: buy, sell, short and cover. For all these actions, we will review how to efficiently place a stop-order and what is its usage.

Stop-Buy order:

  • What is a Stop-Buy order and when should I create this?
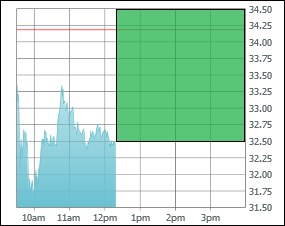
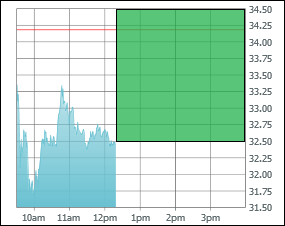
    • A Stop-Buy order is an order that will be transformed to a market order only when the market price reaches the stop price or above. To have an efficient Stop-Buy order, you will have to place a target price that is higher than the market price.
    • You should create this order if you wish to purchase a stock once it has passed a target price. As an example, let’s pretend you just read some positive news on stock ABC and expect the stock to soar. If you wish to see a little increase before jumping in, you can always create a Stop-Buy order so the system will include stock ABC in your open positions and be able to profit from “thereafter” rise.
  • Graphically, what does it look like?
  • stop graph
    • To create an efficient Stop-Buy order, you would have to place an order with a target price in the green region.
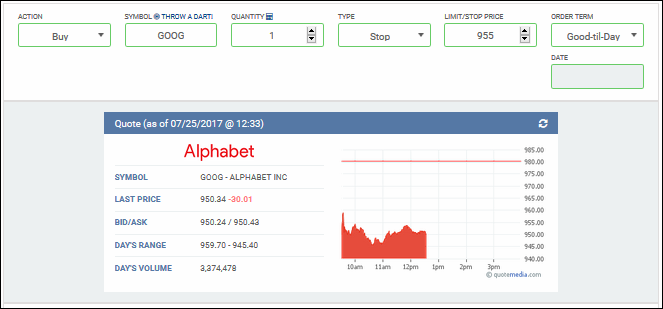
  • How to place it on HTMW
    • stop image
    • Make sure to review the ask price and to switch the order type to “Stop”. You can also adjust the order term according to your preferences.

Stop-Sell order:

  • What is a Stop-Sell order and when should I create this?
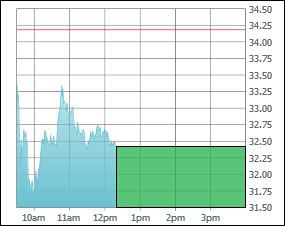
    • A Stop-Sell order is an order that will be transformed to a market order only when the market price reaches the stop price or below. To have an efficient Stop-Sell order, you will have to place a target price that is lower than the market price.
    • You should create this order if you wish to sell a stock once it reaches a specific target price. This will help you manage your portfolio and automatically send a market order to sell your order once it reaches the price for which you wish to close your position immediately. In other words, it is useful in cutting your losses.
  • Graphically, what does it look like?
    • trailing stop
    • To create an efficient Stop-Sell order, you would have to place an order with a target price in the green region.
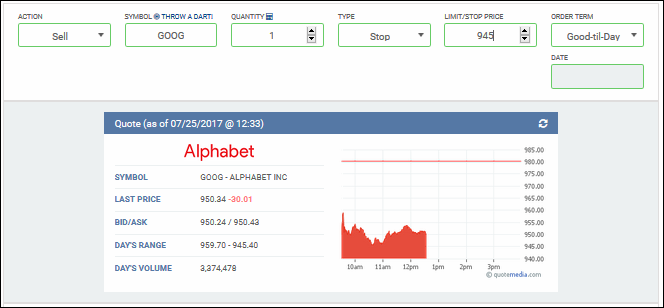
  • How to place it on HTMW
    • trailing stop demo
    • Make sure to review the bid price and to switch the order type to “Stop”. You can also adjust the order term according to your preferences.

Stop-Short order:

  • What is a Stop-Short order and when should I create this?
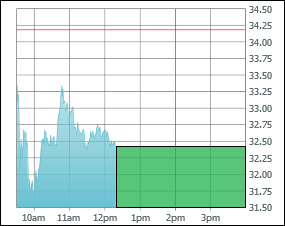
    • A Stop-Short order is an order that will be transformed to a market order only when the market price reaches the stop price or below. To have an efficient Stop-Short order, you will have to place a target price that is lower than the market price.
    • You should create this order if you wish to short a stock once it has passed a target price. As an example, let’s pretend you just read some negative news on stock ABC and expect the stock to tank. If you wish to see a little decrease before making a move, you can always create a Stop-Short order so the system will short sell stock ABC in your open positions and be able to profit from “thereafter” drop.
  • Graphically, what does it look like?
    • short stop
    • To create an efficient Stop-Short order, you would have to place an order with a target price in the green region.
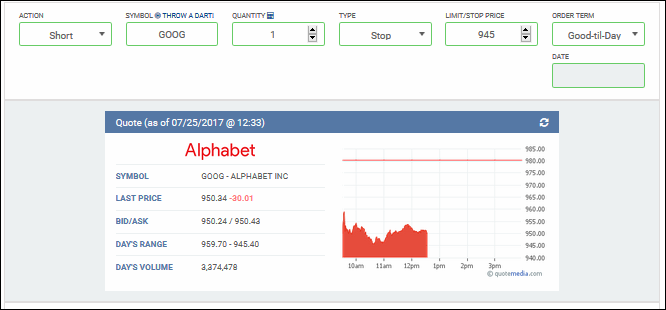
  • How to place it on HTMW
    • short stop image
    • Make sure to review the bid price and to switch the order type to “Stop”. You can also adjust the order term according to your preferences.

Stop-Cover order:

  • What is a Stop-Cover order and when should I create this?
    • A Stop-Cover order is an order that will be transformed to a market order only when the market price reaches the stop price or above. To have an efficient Stop-Cover order, you will have to place a target price that is higher than the market price.
    • You should create this order if you are currently in a short position and wish to cut your losses at a specific target price. By creating a Stop-Cover order, it will help you manage your portfolio in an automated manner.
  • Graphically, what does it look like?
    • short stop cover
    • To create an efficient Stop-Cover order, you would have to place an order with a target price in the green region.
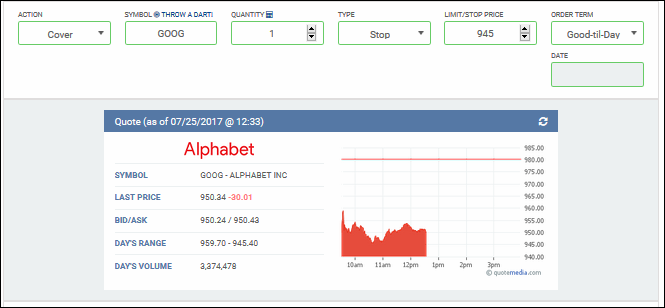
  • How to place it on HTMW
    • short stop cover image
    • Make sure to review the ask price and to switch the order type to “Stop”. You can also adjust the order term according to your preferences.


Definition:

A limit order is an order to buy or sell a stock at a specific price or better. A buy limit order can only be executed at the limit price or lower, and a sell limit order can only be executed at the limit price or higher. It is not guaranteed to execute and can only be filled if the stock’s market price reaches the limit price. While they do not guarantee execution, they help ensure that an investor does not pay more than a predetermined price for a stock.

Limit Order Explanation:

Limit orders typically cost more than market orders. Despite this, they are beneficial because when the trade goes through, investors get the specified purchase or sell price. Limit orders are especially useful on a low-volume or highly volatile stock.

Make sure to look at Stop orders as well. They are just the opposite of Limit Orders.

You can also take a look at our comprehensive limit and stop order article including how to use them on HowTheMarketWorks.com

Definition:

Market Orders are an order to buy or sell a stock at the best available price. Generally, this type of order will be executed immediately. However, the price at which a market order will be executed is not guaranteed. It is important for investors to remember that the last-traded price is not necessarily the price at which a market order will be executed. In fast-moving markets, the price at which a market order will execute often deviates from the last-traded price or “real time” quote. Not only is there a deviation from the “real-time” quote but the price it executes at is always the bid – ask price.

Details on Market Order:

Market orders guarantee execution as long as there is enough volume and a bid – ask price, and it often has low commissions due to the minimal work brokers need to do. Be wary of using market orders on stocks with a low average daily volume: in such market conditions the ask price can be a lot higher than the current market price (resulting in a large spread). In other words, you may end up paying a whole lot more than you originally anticipated! It is much safer to use a market order on high-volume stocks.

Definition: The ask or offer price is the lowest price that a seller is willing to accept for a stock or other security. The ask size will specify the number of shares the seller is willing to sell at that ask price.  This is also sometimes called “the ask” or “ask price” or “offer price.”

Example: When you get a quote on a stock  or security you will often see the Last Trade Price and the current Bid/Ask prices.  For example, Google might have a Last of $700.75 and be Bid $700.50 and Ask $701.00.  A quote screen might also show the bid/ask size and show $700.50 x 1,000 and $701.00 x 500.  This would mean that you could immediately buy 500 shares at $701 or sell 1,000 shares at $700.50. The ask price is the complement of the bid price. The bid is the highest price a buyer is willing to pay for a stock or security.  The ask will always be higher than the bid.

Visit these other Glossary Words that you MUST KNOW in order to understand How The Market Works!

Other Important Glossary Terms you MUST KNOW::
      > Ask Price
      > Bid Price
      > Market Order
      > Limit Order
      > Trailing Stop Order
      > Dividend
      > P/E Ratio
      > ETF
      > Mutual Fund
      > Preferred Stock
      > Fundamental Analysis
      > Technical Analysis
      > Cup and Saucer
      > Double Bottom
      > EPS (earnings per share)
      > GTC Order (Good Til Cancel)

Click Here to see all Beginner Stock Trading Articles

Definition:
When you are selling your shares of a security, the bid price is what the buyer is willing to pay for your shares. This Bid Price offers you an exact price of how much you can sell your shares for. The Last Price offers you a look at what price the last trades were made; which is not sufficient to give you a price a buyer is willing to pay. Bid Price and Last Price are often different.  On the other side of the market, even though you are willing to offer a seller a bid price, he/she will only sell at the Ask Price. The Ask Price is the price at which a seller is willing to let go of her shares. More specifically, this is the price you will buy your stocks at.  Finally, the Bid Size comes hand-in-hand with the Bid Price. This is the amount of shares a buyer is willing to pay for a specific amount of shares. This gives the seller a better view on where they stand.

Example:
$23.53 x 1,000 is an example of a bid.  This means that an investor is asking to purchase 1,000 shares at the price of $23.53.  The transaction will be completed if a seller is willing to sell that security at that price. Another example would be a Market bid for 1,000 shares. That means that the investor is willing to take 1,000 shares at the current market price.


Click Here to see all Beginner Stock Trading Articles

Definition
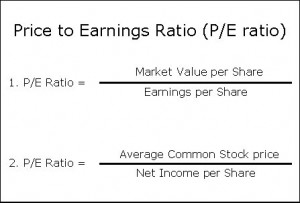
P/E Ratio. It sounds good and makes novice investors feel like they have a grasp of the situation but how valuable is the Earnings Price Ratio? Surprisingly, the price to earnings ratio is a useful tool but certainly not the holy grail of investing as it is sometimes made out to be. For those novice investors, the P/E Ratio provides a numeric representation of the value between the stock price and earnings. To derive the P/E Ratio you divide the share price by the company’s EPS or Earnings Per Share. The formula looks like this: P/E = Stock Price/ EPS

    • Market sentiment. An overly optimistic P/E Ratio can indicate the market expects big things from this company. Temper optimism with reality.
    • Cover priced or over-bought. A high P/E Ratio can indicate a given stock is priced to high and ready for a correction. Be sure to compare against industry norms.
    • Lack of confidence. A low P/E Ratio may indicate a lack of confidence in the future of the company.
    • Sleeper. A low P/E Ratio might be a sleeper just waited to be discovered.

Formula
price earnings ratio

Example
For example, if a company is currently trading at $43 a share and earnings over the last 12 months were $1.95 per share, the P/E ratio for the stock would be 22.05 ($43/$1.95).

Coca-Cola and Pepsi operate in the same industry and produce goods that are very similar in nature.
Coca Cola’s (KO:NYSE) stock price (Price per Share): $66
Coca-Cola’s Earnings-per share (EPS): $5.26
Coca-Cola’s P/E Ratio: $66 / $5.26 = 12.55

Pepsi’s (PEP:NYSE) stock price (Price per Share): $69
Pepsi’s Earnings-per share (EPS): $3.73
Pepsi’s P/E Ratio: $69 / $3.73 = 18.50
From our calculations, we can see that Pepsi has a higher P/E Ratio than Coca-Cola.

This could be perceived a couple of different ways:

      • Coca-Cola is under-valued and should be bought.
      • Pepsi is over-valued and should be sold or shorted.
      • Investors do not perceive Coca-Cola as doing as well as Pepsi presently.
      • Pepsi is launching a new product that Coca-Cola is not.

The truth is normally some combination of these perceptions.

How to use the P/E Ratio

The P/E Ratio by itself is just a number. Just because it is high or low does not lend much intuition by itself.

But, when we compare P/E ratios between companies and industries, we really start getting the picture for the particular company we are analyzing.

It does not make much sense to compare P/E Ratios of companies across different industries, as each industry has its own unique way of conducting business.

It’s like comparing a doctor with an engineer to see which one is more valuable.

Hence, if comparing P/E ratios, you should compare between companies in the same or similar industries.

You may also compare the P/E ratio of a company to the P/E Ratio of the entire industry that it operates in to analyze whether the stock is over or under-valued.

How to interpret the P/E Ratio

High P/E Ratio may mean:
Market sentiment: An overly optimistic P/E Ratio can indicate the market expects big things from this company. The company has high growth possibilities.
Lifecycle: The company could be entering into the Growth or Shake-Out stage of its lifecycle.
Industry: Specific Industries have a certain level for the P/E Ratios. For example most technology companies have high P/E Ratios.
Cover priced or over-bought: A high P/E Ratio can indicate a given stock is priced to high and ready for a correction. This means that it might be over-valued. Be sure to compare against industry norms.

Low P/E Ratio may mean:
Lack of confidence: A low P/E Ratio may indicate a lack of confidence in the future of the company.
Lifecycle: The company could be in the Mature or Decline stage of its lifecycle.
Industry: Specific Industries have a certain level for the P/E Ratios. For example most utility companies have low P/E Ratios.
Sleeper: A low P/E Ratio might be a sleeper just waiting to be discovered. This means that it might be undervalued, and a perfect time to start buying the shares.

Important Note

      • The Earnings-Per-Share in the P/E Ratio formula is a number that comes from the accounting books of the company.
      • Hence, it is possible to manipulate the EPS and hence the P/E Ratio in order to trick investors into perceiving the stock differently.
      • It is important to independently verify that the company’s’ financial statements are sound and true.

Conclusion
A PE Ratio is an important valuation tool that can give key insights into whether a stock may be over or under-valued.

Also sometimes known as “price multiple” or “earnings multiple.”


BEGINNERS: Learn To Trade Stocks

Intro to Stocks IPO
Trading Rules Bid
Volume Precedes Price and Confirm Price Patterns Ask
Trade with the HTMW Game Market Order
Making Your First Stock Trade Ticker Symbol
P/E Ratio Stock Quotes
Dividend Stock Charts
Dividend Yield

Click Here to see all Beginner Stock Trading Articles


Definition:
A ratio showing how much a company pays in dividends each year relative to its share price. Assuming that the stock price does not change, the dividend yield is the only return on the stock holder’s investment.

Dividend Yielddividend yield


Example: Dividend yield is a way to measure how much “bang for your buck” you are getting from your investment through  dividends.

To better explain dividend yield, lets explore an example. If two companies pay the same annual dividends of $1 per share per year, but XYZ company’s stock sells at $20 while ABC company’s stock sells at $40, then XYZ has a dividend yield of 5% while ABC is only yielding 2.5%. Assuming that all other factors are the same, an investor that is looking to add to his or her income would likely prefer XYZ’s stock over that of ABC’s stock.

Click Here to see all Beginner Stock Trading Articles


Definition: Payments made to shareholders by corporations. When a company earns profit, the company can use the money to either re-invest in the business (called retained earnings) or to give shareholders as dividends or share repurchase. Many corporations keep a portion of their profit and pay the remainder as a dividend.

Explanation: Corporations can pay dividends in the form of cash, stock or property. Most large profitable companies offer dividends to their stockholders. Their share prices might not move much, but the dividend they pay make up for this.

Higher-growth companies typically don’t offer dividends because their profits are reinvested to help continue their higher than average growth.
 
BEGINNERS: Learn To Trade Stocks

Intro to Stocks   IPO
Trading Rules   Bid
Volume Precedes Price and Confirm Price Patterns   Ask
Trade with the HTMW Game   Market Order
Making Your First Stock Trade   Ticker Symbol
P/E Ratio   Stock Quotes
Dividend   Stock Charts
Dividend Yield  

 
Click Here to see all Beginner Stock Trading Articles
 

Preferred stock is a special class of stock issued by a company that pays dividends. Preferred stock is more like a bond than true stock because the main appeal is dividend income. Most are limited in the total profit they can earn. Some of these stocks can be tied to certain projects a company offers and can be less like traditional preferred stocks.

Further explanation of Preferred Stock:

There are certainly pros and cons when looking at preferred shares. Preferred shareholders have priority over common stockholders on earnings and assets in the event of liquidation and they have a fixed dividend (paid before common stockholders), but investors must weigh these positives against the negatives, including giving up their voting rights and less potential for appreciation. In general, these types of stocks can be a good balance between the pros and cons of bonds and common stocks.

Definition:

Common stock is a form of corporate equity ownership, a type of security. The terms “voting share” or “ordinary share” are also used in other parts of the world. It is called “common” to distinguish it from preferred stock. It usually carries with it the right to vote on certain matters, such as electing the board of directors. However, a company can have both a “voting” and “non-voting” class of common stock.

Further Explanation of Common Stock:

If the company goes bankrupt, the common stockholders will not receive their money until the creditors and preferred shareholders have received their respective share of the leftover assets. This makes common stock riskier than debt or preferred shares. The upside to common shares is that they usually outperform bonds and preferred shares in the long run. However, unlike preferred stock the common equity also, in general, receives less dividends.

What is a Ticker Symbol?

A ticker symbol is a unique one to five letter code used by the stock exchanges to identify a company. It is called a ticker symbol because the stock quotes used to be printed on a ticker tape machine that looked like the images below. When it printed the stock quotes, it made a tick-tick-tick sound!

History of Ticker Tape Machines

Caution: When researching a company, don’t be tricked into thinking that the ticker symbol is just an abbreviation of the company name. Sometimes it is very different.

For example, here are some popular and interesting ticker symbols:

TickerCompany
WMTWalmart
AAPLApple
DOWDow Chemical
FFord
TickerCompany
LUVSouthWest Airlines
HOGHarley Davidson
BUDAnheuser-Busch
KOCoca-Cola

How do companies pick their tickers?

It depends on who is in charge! Companies can choose whatever they want to be their ticker symbol, as long as it’s not already taken, and the regulators don’t think it’s misleading. In a famous case, a company was prevented from choosing FBI as their ticker.

Usually, companies pick a ticker that could be an abbreviation for their company to make it easier for investors to find. Other times, the connection is less obvious. In the examples above, we have:

  • LUV, for SouthWest Airlines. They chose this ticker symbol because their business started at Love Field, an airport in Texas.
  • HOG, for Harley Davidson. Motorcycle fans will often refer to Harley motorcycles as Hogs, which they borrowed for their ticker.
  • BUD, for Anheuser-Busch, is a brewing company, and one of their most popular beer brands is Budweiser, which they used for their ticker.
  • KO, for Coca-Cola. CO was already taken when Coca-Cola first became a public company, so they chose the next-best sounding ticker.

Companies will usually choose the shortest possible tickers, since longer tickers seem like newer, less-established companies.

Why do we use tickers?

You must have the stock’s ticker symbol in order to place your first trade!  It is the only way to make sure you are buying the shares of the company you want. So please make sure you find the correct ticker symbol.

Most beginning investors find it confusing to use ticker symbols because before you can begin to do any stock research, you must look up the ticker. And when you do look up tickers, you will often be surprised how many companies there are that have very similar names. Make sure you are buying the stock that you think you are buying. Ticker “COKE” is not the Coca-Cola Company! Wouldn’t it just be easier if we used the company names? HowTheMarketWorks tries to help this with our Smart Trade Drop-Down, where by typing the company name in the trading window, we will give you tickers that match. Click here to try! However, lets take a look at where ticker symbols came from, and why we still use them today.

Early Tickers

Ticker Machine

Ticker machines first came into use during the late 1800s as a fast way to move news across far distances; they used telegraph lines to transmit messages electronically. However, with a telegraph machine, each letter of the message had to be spelled out in Morse Code (a series of dots and dashes), read by the operator on the other end, and then typed out onto a message to be actually read by anyone.

This was a time-consuming process; the longer the message, the longer it took to write, translate, and read. To speed things up, shorthand writing (the predecessor of today’s “text speak”) was invented. Famously, an old British admiral was the first person to use “OMG” as shorthand in a message to one of his colleagues.

For investors looking to get the latest stock prices, this was also a problem. Since there were hundreds of companies being traded and prices being updated every minute, the longer it took to communicate a company’s price meant the whole stream of information was held up. Thus, company names were shortened down to 1-5 characters, and the first ticker symbols were born.

Rise of Electronic Trading

Today, the original reason for tickers is still important; computers still take time to process longer names, so shorter codes can be a lot faster when executing billions of trades per day. If you are making trades as fast as you could, it would take almost 5x longer to write The Coca-Cola Company than it would be to write KO. It saves time and helps to distinguish between companies that have very similar names.

Other Ticker Symbol Information

Sometimes you might see a “.A” or “.B” after a ticker symbol. This usually indicates a class A or class B type of shares. Sometimes you might see a ticker ending with a “Q” this means the company has filed for bankruptcy. Sometimes you might see a “Z” added to the ticker, this means that there is a special situation occurring with the stock.

How to Find a Stock’s Ticker Symbol

On most financial websites, you will find a Quotes or Get Quotes link. When you click on those links, it will take you to a stock quote screen. Usually there is a link on that page that says Ticker Symbol Lookup or similar. If there is not a ticker symbol lookup link, then try just typing the company name in and some pages will show you related tickers.

You can look up any ticker by going to the Research tab on the main menu, and clicking Symbol Lookup.

Ticker Symbol Lookup Tool