There’s been a lot going on in the technology sector lately, with the NVIDIA Corporation (NASDAQ: NVDA) sell off and the selloff in late June after Alphabet Inc Class A (NASDAQ: GOOGL) got hit with a $2.7B fine, which pushed the stock down over 2% after the announcement.

Volatility in NASDAQ-100

Now, in early June, the tech sector fell significantly, with Apple Inc (NASDAQ: AAPL), the world’s largest company by market capitalization, leading the selloff. Apple had its worst plummet in around 14 months, and investors were concerned that the rally in the tech sector might be over. However, traders were loving this volatility, as it provided some opportunities that they could have potentially profited off of.

According to Wedbush Securities San Francisco Senior Vice President Stephen Massocca, “All you need is a spark. Everything has gotten pretty expensive, multiples are very high. It doesn’t take much to get a decline started.”

One of the most talked about stocks that day was NVDA, after Citron Research’s Andrew Left tweeted  about the chip maker. Here’s what Citron Research tweeted, $NVDA become a casino stock. Will trade back to $130 before $180 If you think no comp READ Google whitepaper http://Citronresearch.com.”

According to trader Jason Bond, “Citron Research has been moving stocks with its tweets and research, after their famous short call on Valeant Pharmaceuticals. When they tweet, it’s a catalyst event, and it’s uncovered some potential trading opportunities in those names.”

Take a look at the chart below of QQQ.

qqq

Source: TradingView

The selloff in early June may have been sparked by comments made by Citron Research, which trickled down to other tech names.

A few weeks later, as stated earlier, Google got hit with a $2.7B fine, and the stock started selling off. Thereafter, this led some other tech stocks to sell off, and the Nasdaq-100 ETF ended the day down over 1.5%.

Here’s how the PowerShares QQQ Trust, Series 1 ETF (NASDAQ: 100) traded in the start of the last week of June.

powershares

Source: TradingView

For investors and traders who are still long technology stocks, but want to hedge some risk, they could potentially use gold to diversify their holdings.

Gold As A Hedge

Historically, we’ve seen precious metals rise when the market is selling off. The primary reason for this is due to the market’s view of gold and silver as potential safe havens. That in mind, if the technology sector continues to experience volatility, some investors and traders might want to look to gold as a hedge. However, those who don’t want to hold physical gold could use exchange-traded funds that provide exposure to gold.

Now, when gold prices rise, this trickles down to gold miners, and ultimately, exchange-traded funds (ETFs) tracking the gold mining industry, such as the Market Vectors Gold Miner ETF (NYSEARCA: GDX), tend to rise.

That in mind, some investors would want to look to an ETF like GDX and the SPDR Gold Shares (NYSEARCA: GLD) to potentially hedge against another sell off in the tech sector.

The Bottom Line

Volatility could come back into the technology sector, which could ultimately affect the overall market. We’ve seen NVDA fall significantly, after Citron Research tweeted about the name. Additionally, we saw the European Union slap Alphabet Inc  with a $2.7B fine, causing the stock to selloff, which trickled down to some other technology names. That in mind, those who are still long tech stocks might want to consider hedging their portfolios.

An investing strategy is a plan for how to save money to help it grow. Sometimes this can be just a plan for trading stocks, but it really means a lot more.

Liquidity, Risk, and Potential Returns

All investments balance liquidity (how easily it can be converted into cash for other use), risk (the chance of the investment to lose value), and potential returns (how fast your investment can grow).

The balance between these three items is up to your own individual taste, but it is this balance that will determine what kinds of investments you choose.

Security Types

The security type is what you are holding as an investment. These can be a very wide range, but every full portfolio should have a mix of a couple.

Cash And Bank Deposits

Cash

Liquidity: Very High
Risk: Low
Potential Growth: Zero or Negative

Cash, believe it or not, is an investment in and of itself. Cash, and bank deposits you can withdraw right away, are the most liquid assets, since liquidity is basically how quickly you can convert any investment into cash.

Being able to always use cash for whatever you want is valuable. This is why Emergency Funds exist as cash and bank deposits, not as bars of gold. On the other hand, cash does not grow, and loses value over time due to inflation.

Certificates of Deposit

Certificates of Deposit

Liquidity: Low
Risk: Low
Potential Growth: Low

A Certificate of Deposit is like a savings account with a locked-in interest rate, but you cannot withdraw the cash for a certain period of time. These are very safe investments, but on the other hand they have a very low potential for growth.

Stocks

Disney Stock Certificate

Liquidity: High
Risk: Medium
Potential Growth: High

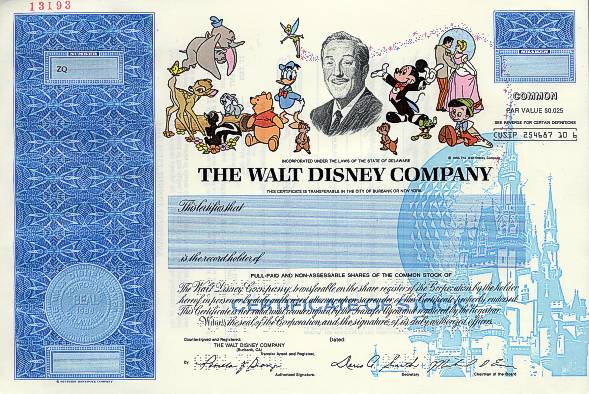
Stocks are usually what come to mind when thinking about investments. As far as an investment strategy is concerned, mutual funds and ETFs which hold stocks are all the same thing – buying a piece of one or many companies in exchange for a share of their profits.

For more information on why to invest in stocks, Click Here.

Bonds

Bonds

Liquidity: Medium
Risk: Low
Potential Growth: Medium

Bonds come in three flavors, Corporate Bonds, Treasury Bonds, and other Government Bonds. Unlike stocks, a bond is a loan that you make to a company or government, and they need to pay it back plus interest. Corporate bonds from large companies and treasury bonds are usually very safe investments (and so there is a lower return), but there are also Junk Bonds, or bonds which have a higher risk of not being paid back in full. In exchange for the higher risk, organizations who sell Junk Bonds offer higher interest rates to people who buy them.

Real Estate

Real Estate

Liquidity: Low
Risk: Medium
Potential Growth: Medium

Real Estate includes land and buildings. Until fairly recently, the bulk of retirement savings was in the form of the house you lived in. People would buy a house and hope that the value grew enough over the next 30-40 years to sell it and use the profits for retirement. Others buy damaged or discounted houses and do repairs, then sell them for profit (this is known as house flipping).

Since the housing marked crash in 2007, people are more wary of real estate investing, but owning a home is still a very popular investment.
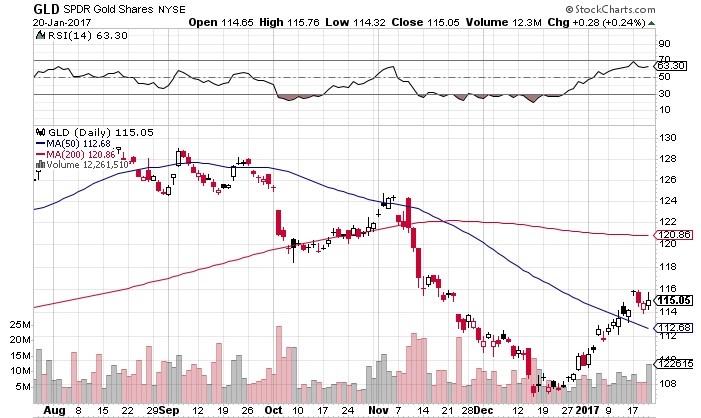
Precious Metals

Gold bars

Liquidity: High
Risk: Medium
Potential Growth: Medium

This includes buying gold and silver. Many investors try to buy gold and other precious metals as an investment (and to protect against inflation), but this has also backfired in recent years as a “Gold Bubble” popped, making the prices of the metals more volatile than before. Holding precious metals as a safeguard against market uncertainty in other security types is still very popular, however.

Derivatives

Options

Liquidity: Medium
Risk: High
Potential Growth: High

Derivatives that normal investors can purchase include stock options and futures. Being a derivative means that it derives its value from something else. A stock option has value because the stock that it lets you buy has value (but the contract itself is useless unless you use it). Futures are good for commodities like oil delivered at a future date.

Derivatives are most useful for hedging (such as buying a stock option for a stock you think will go up in value, but you don’t want to necessarily buy right now).

Tips and Tricks

Many years ago, a common piece of investment advice was that if you are building an investment strategy for retirement, a large chunk of your nest egg would be held in your house, which will mature with the market rates.

For the rest of the assets, financial planners would recommend to balance your assets between stocks and bonds according to your age. Basically take 100, subtract your age, and that should be the percentage of your portfolio in stocks (with the rest in bonds). This means an 18 year old would have 82% of their savings with 18% in bonds.

This advice is a bit out-dated, but it does have a couple important kernels of wisdom that all investors should be aware of.

Don’t Keep All Your Eggs In One Basket

Always keep a diversified portfolio, both in security types and which stocks and bonds you choose! Diversify at a few different levels. Split your assets between a few different security types. In the classic example, the saver would have about 50% of their savings stored in real estate, with the remaining 50% divided between stocks and bonds. This means that if there is a fall in housing prices, they are protected by having lots of savings in stocks and bonds. If the stock market starts to fall, they’re still OK because they have their house and bonds. The value of bonds is determined by the prevailing interest rates, so they are insulated from this as well with their other security types.

On the other hand, they also benefit if there is a surge in housing prices, stock prices, and interest rates.

Use An Evolving Portfolio

The old adage of “more bonds as you get older” is based on the idea that as you get closer to retirement, your portfolio should get more conservative. If you have lots of stock that lose value when you’re 25, you still have 40 years of income to make up for it. If you have lots of stocks that lose value when you’re 62, it becomes a lot more difficult to make up that income.

Common Investing Strategies

If you’re ready to start investing, there are a couple major strategies to keep in mind. Most long-term investing strategies are based on one, or a combination, of these.

Buy And Hold

“If you aren’t willing to own a stock for ten years, don’t even think about owning it for ten minutes.” – Warren Buffet

The Buy and Hold strategy is based on the idea that you do extensive research on what you’re buying, choosing your investments for solid long-term reasoning, then buy it and hold on to it, regardless of what its market price does. The only time to sell is either:

  • When the underlying reasons why you bought the stock change (such as the company’s management changing to a team with a different business strategy you don’t like), or
  • When you plan on exiting the market entirely

Warren Buffet is generally considered the most famous Buy and Hold investor.

Downside

“The market can stay irrational longer than you can stay solvent.” – John Maynard Keynes

Even if all your research is great, and even if what you invested in does regain all its value in the long run, you still have a deadline of when you need that money to live on in retirement. You also have a very real chance of just being wrong in your choice, and with a Buy and Hold strategy you might take a huge loss before admitting defeat.

Value Investing

“Know what you own, and know why you own it.” – Peter Lynch

Value Investing is looking for stocks that are under-valued compared to the rest of the market. This means looking for companies that seem to be growing strongly but have not yet attracted much market attention, or new players with solid foundations and the potential for growth. You will buy and sell stocks more often with value investing – as soon as your picks start looking “priced in” or “over-valued”, you’ll start thinking about selling and moving on.

Peter Lynch was made famous by his use of Value Investing while acting as the primary manager of the Magellan Fund Fidelity Investments.

Downside

“The four most expensive words in the English language are, ‘This time it’s different.’” – Sir John Templeton

Value investing requires you to pay close attention to companies and re-evaluate how much you think they’re worth regularly. If you’re wrong a few times in a row, you could have trouble bouncing back.

Active Trading

“Understanding the value of a security and whether it’s trading above or below that value is the difference between investing and speculating.” – Coreen T. Sol

Active Trading is when you are buying and selling stock regularly. Day Trading is when you buy or sell in the same day, trying to take advantage of market swings to earn a profit. Active trading requires more advanced knowledge of chart patterns, fundamental and technical analysis, and an appetite for risk. In exchange, you can make huge returns with active trading by riding market trends.

Downside

“The individual investor should act consistently as an investor and not as a speculator.”  – Ben Graham

Active trading can get big returns quickly, but it can get big losses even faster. Most professional investors and financial advisers suggest using only a very small portion of your portfolio for active trading, since the damage can be hard to undo.

Ready to Get Started?

If you need a little more guidance, check out How to Pick Stocks, you’ll learn more about evaluating the performance of different companies so you know which will be the best to add to your portfolio. Then, when you’re ready to test out your trading ideas, create an account on HowTheMarketWorks to buy your first few stocks. Discover the best investing strategies for you before you use real money!

Nobody ever said that being an entrepreneur would be an easy task – it is probably tougher to be an entrepreneur (at the start) than to work a 9-to-5 job. One of the things that make it hard to be an entrepreneur is the money matters that arise over the course of starting and running a business. This piece provides insight into 10 creative ways for raising funds for a business.

Squeeze more money of yourself

If you need more funding for your business, you should start by finding ways to squeeze money out of yourself before looking for loans from external sources.

  • Don’t fire your boss yet: You can alleviate some of the cash problems ailing your business by keeping your current job. Keeping your current job will provide you with a steady source of income while you continue to work on your business
  • Get another job: if the income from your current job is not enough to raise your startup capital, you should consider taking on a second job. You can take on a part-time second job or start looking for ways to make money with your skills as a freelancer
  • Downsize personal expenses: You can free up more money for your business by finding ways to reduce your expenses. Perhaps it is time you learnt how to cook instead of eating out. You can also clip coupons and watch movies on Netflix.
  • Sell off some personal assets: If you have gadgets, a second car, or other valuables, you should consider selling them to raise more money for your business.

Approach loans from a unique perspective

Sometimes, the odds of getting a loan from traditional sources are simply stacked against you. Maybe your business is new, your industry is struggling, or you didn’t meet some other requirements. You can get creative to raise the funding you need.

  • Short-term loans: short-term loans are perfect for meeting short-term financing needs. If your business has a strong cashflow, short-term loans are probably the fastest routes for getting industry funding with minimal hassle.
  • Invoice factoring: You can borrow money against your account receivables by doing invoice factoring. With invoice factoring, a lender gives you money against your unpaid invoices (minus a fee)
  • Customer financing: if your business serves a sort of independent contractor to a much larger business, you can get money to keep your business afloat through customer financing. You only need to prove to the customer that they have much to gain by giving you an advance/loan to keep you in business.

High-risk loans

Sometimes, you just need the cash to save your business from going under the water and you won’t think twice about borrowing money from the devil himself. If you are in a desperate need for cash, you may want to look at some of the following options. Of course, it’s in your best interest to seek the input of a financial advisor before you take any of these high risk loans.

  • Home equity loan: You can get serious funding for your business if you don’t mind taking out a loan against the value of your home equity. Don’t default; otherwise, you’ll be moving out (or become homeless)
  • Title loans: you can get a title loan against the value of your car if you have already paid of the auto loan on the car.
  • Whole-life insurance: Many people are soaking money away in life insurance policies – you can borrow against your life insurance policy if you have paid a decent amount in premiums over the years. You’ll need to ensure that you don’t terminate the policy, default on the loan, or die until the loan is repaid.

What is income tax?

Income tax is the tax you pay on your income, usually directly taken out of your paycheck. Everyone who works in the United States should be paying income tax on their earnings.

Income is more than just wages and salaries too. If you earn rents from rental properties, investment income, interest on your savings account or bonds, or any other revenue stream, you will probably owe some income tax on it.

How are income taxes paid?

For most people, income taxes are straightforward – employers are required to withhold the appropriate income tax amount from your paycheck, which is then paid to the government without any extra steps.

If you are self-employed or work as an independent contractor (like a driver for Uber), it can be a bit more complicated. In this case you are required to report your income and pay any taxes owed at the same time.

Who needs to file an income tax return?

All US citizens and everyone working and living in the United States needs to file an income tax return each year. By extension, all citizens and workers in the US need to report their income, even if that income is earned in another country. US citizens use their Social Security Number to file their taxes.

Even US residents who do not work need to file income taxes if they received some sort of income or compensation over the previous year. This includes things like rental earnings and even unemployment benefits.

Immigrant Workers

Workers who work in the United States without a Social Security Number (both legal immigrants and undocumented workers) are still required to pay income taxes. Since some of these workers may not have Social Security Numbers, they can request an Individual Tax Identification Number (ITIN) from the IRS to use to file their taxes.

ITIN numbers can only be used for tax reporting purposes, and undocumented workers can avoid breaking income tax evasion laws by obtaining a ITIN number and filing their income tax returns.

US Citizens Living Abroad

US Citizens who live and work in other countries are also required to file their US income taxes each year or risk heavy fines. While citizens do need to file their taxes, most citizens living and working outside the US are exempt from actually owing any tax, unless they have exceptionally high incomes.

What do I need to file my income taxes?

In addition to a Social Security Number or Tax Identification Number, there are additional forms needed at the minimum to file your income tax.

Form W2

w2

The W-2 form is a document all hourly and salaried employees will receive from their employer at the end of the year (usually in January, covering the previous year). The W-2 form is a fairly basic form outlining the total wages earned in the previous year, along with how much Social Security and Income Tax was already withheld by the employer and paid. Employees receive their W-2 form already filled out from their employer.

You will usually receive 3 copies of your W-2 form – one for your personal records, one to be submitted with your federal tax return, and one for your state tax return.

You can file your income taxes with just a W-2 form if you received no other income or compensation in the previous year.

Form 1099

Form 1099 is used when a person needs to self-report income. This includes independent contractors, and anyone receiving income from a source that did not provide a W-2.

Form 1099 is more complicated than the W-2, both because there are many more types of income that can be reported, and because anyone who uses it may need to fill out all the information themselves (although whoever pays you might provide you with a pre-filled version). This requires more skills at keeping detailed financial records than the basic W-2.

The 1040 Income Tax Return Form

1040 forms

The basic income tax return form in the United States is known as the Form 1040. The basic use of the form is to add up all your income from the year from all sources, calculate how much tax you have already paid, subtract any deductions you qualify for, and see how much of a tax return you should receive or how much tax you currently owe.

The 1040 is a simple one-page tax return. If you have a fairly simple financial situation (few deductions, little external income), you can just fill out the one-page form and send it in. If you have more complicated income and expenses to file, you might need to include additional “Schedules” – supplementary forms outlining your other income and expenses.

Parts of the 1040

There are four basic parts of the 1040 EZ

  • Contact Information – This will include your name, address, and Social Security Number. You can file the 1040 EZ form jointly with your spouse if you are married, in which case you would provide his or her information as well.
  • Income – This information should come directly off of your W-2 form any any interest tax forms your bank sends you for savings accounts. This also includes any unemployment compensation you may have received.
  • Payments – This also comes from your W-2, which lists how much tax was already withheld and paid by your employer. This is also where you can calculate the total amount of tax owed.
  • Refund or Tax Owed – The final calculations show how much refund you should receive, or how much income tax you need to pay. If you should be getting a refund, you can provide your bank routing number for a direct deposit. If you owe tax, there are instructions included on how to pay it.

Collecting your return

It is easy to collect your return. All income tax return forms include a place where you can put your bank routing information to get your return direct deposited to your bank account with no extra steps.

If you prefer receiving a check, the IRS will mail a check to the address you posted at the top of the form.

Income Tax Corrections

Taxpayers have 7 years in the United States to file any corrections. Usually this would be to claim deductions you may have missed, or report income later to avoid tax evasion penalties.

To file an amended tax return, use the Form 1040-X, which is designed specifically for later corrections on a previous return.

IRS Corrections

calculator

The IRS may also apply corrections directly based on their own calculations of your taxes owed. If this is the case, they will generally mail you a letter explaining how their calculation differs from theirs, along with a method to dispute their calculation.

The IRS has been known to adjust returns both up and down – they are mainly checking for errors in the deduction amounts and arithmetic to ensure the returns are processed correctly.

Audits

There is a small chance that your income tax could be audited by the IRS, in which case they will ask you to bring in supporting documents. Audits are designed both to ensure the tax returns are using all the correct values, and to prevent fraudulent claims. Audits can happen up to 6 years after your taxes have been filed, so you should be sure to keep all your supporting documents for at least that long.

State income taxes

Most states also levy an income tax, but the actual tax amount and thresholds will vary quite a lot from state to state. Steps for filing state income taxes are very similar to the federal taxes, and generally require the same documentation (which is why you will typically receive 3 copies of a W-2 form).

There are currently seven states with no income tax: Alaska, Florida, Nevada, South Dakota, Texas, Washington, and Wyoming. States that do not charge income tax make up for the lost revenue through other channels, usually sales taxes and use taxes (in fact, states with no income tax typically charge their citizens higher total taxes than those who do have income taxes).

Investing in stocks has traditionally been done through actual purchase and possession of stocks of a particular company. However, this comes with the risk of having to stick with the stock even when the price is falling and you do not find a ready buyer in the market immediately. In addition, for some other stocks you might need a huge capital outlay in order to purchase them due to their high price per share in the market. To overcome these challenges, you can choose investment strategies that allow you to trade on the stock of your choice without actually having to own it.

Trading on price movements of underlying assets

Derivatives are financial instruments that allow you to trade based on the price movements of the underlying assets without having to own the underlying assets. This gives you the protection from holding onto loss making stocks when there are no willing buyers immediately. You achieve this through the ease of exit provided by derivatives incase the market moves towards the red and you would like to let go the derivative instrument you are holding. Derivatives come in different forms and they range from the very complex financial instruments traded in futures markets by hedge funds to very simple and easy to learn binary options trading and spread betting.

For beginners, binary options trading and spread betting are the easiest to understand and start executing if you are looking for an alternative stock investment strategy. Both binary options and spread betting allow you to trade based on the price movement of the underlying stock or any other asset class that you choose; while actually not owning the underlying asset. The two trading strategies are similar in that they are executed via online trading accounts that are hosted by online trading brokers. To secure your online transactions, you will however need to thoroughly screen different brokers before landing on your preferred online trading platform. In addition, you need to consider the additional trader support offered by different platforms such as the daily market reviews offered by SaxonTrade before making the final choice. After choosing the right online trading platform, you will then need to start learning how to trade via demo accounts before delving into the live account where you invest your real money.

Differences between binary options trading and spread betting

Binary options trading differ from spread betting in a number of ways. For binary options, you make a yes or no decision with regard to the price movement of your chosen stock. If you predict that the price will go up, this is referred to as a call option; while if you predict that the price will drop this is referred to as a put option. Binary options are referred to as fixed risk contracts due to the fact that you only risk a specified amount of money if your prediction for price movement is wrong or out of the money. On the other hand, if the trade goes according to your prediction you are said to be in the money and your payoff is also fixed at certain percentage of your wager.

Spread betting on the other hand primarily differs from binary options trading based on the fact that it has unlimited gains and unlimited loses. In spread betting, you predict whether the price of the underlying stock that you are trading on will rise or fall. Your returns are determined by the difference between the opening price and the closing price of the underlying stock. Unlike binary options where you know your maximum gain or loss before you start trading, in spread betting, your winning or losing chances are unlimited and depend on how far the price movement will be during your trading period. However, you can opt to set a “stop loss” or place a “take profit” level such that you limit your losses and profits and have a bit of control over your risk exposure.

Choosing between binary options trading and spread betting is always a matter of personal preference. Some traders prefer binary options due to their fixed risk and return structure, while shying away from spread betting due to the unlimited risk exposure they possess. However, using stop loss and take profit levels you can be able to mitigate your risk exposure in spread betting while at the same time enjoying the higher margins you stand to gain as compared to binary options trading. Ultimately your risk appetite and desired returns will be a key determinant of which alternative stocks trading strategy you will opt to go with.


A key first step for any entrepreneur is setting up an organization that will be used to formally embark on the business journey, but many new business owners struggle to identify the best way to move forward. These are the most common ways to organize a business, from the simplest through the most complex.

Sole Proprietorship

Sole proprietorship
Small shops are often owned and operated by one person

A sole proprietorship is the most basic form of business ownership, where there is one sole owner who is responsible for the business. It is not a legal entity that separates the owner from the business, meaning that the owner is responsible for all of the debts and obligations of the business on a personal level. In exchange for that liability, the owner keeps all the profits gained from the business. This form of business ownership is easy and inexpensive to create and has few government regulations, making it a more flexible type of ownership with complete control at the discretion of the owner. In addition, profits are taxed once, and there are some tax breaks available if the business is struggling. Sole proprietorships often are limited to the resources the owner can bring to the business. For these reasons, sole proprietorships are often most appropriate during the early stages of a business where the owner has little capital/resources to work with but also has few debts to pay.

Partnership

Business Partnerships
Partnerships are very common with friends going into business together

Partnerships are a form of business ownership where two or more people act as co-owners. There are two forms of partnerships, which are General Partnerships and Limited partnerships, differentiated primarily by the liability coverage by the owners. In a general partnership, all owners of the business have an unlimited liability in the business (the same as a Sole Proprietorship). For a limited partnership, at least one of the partners has a limited liability, meaning they are not personally responsible for the debts of the business. Regardless of the type of partnership, they are relatively easy and cheap to create, have few government regulations and are only taxed once, like a sole proprietorship. The added benefit of a partnership is the combination of knowledge and resources that are brought to the table thanks to the additional owners. Profits do have to be shared between owners and there is always the potential for conflicts to arise between partners over business decisions. This type of ownership is often useful in the early stages of the business where multiple people are involved. Due to the sharing of profits and the additional resources, this type of ownership is often expected to yield higher growth rates then a sole proprietorship.

Corporations

Walmart Corporation
Walmart is currently the world’s largest corporation by revenue

Unlike the previous two examples, Corporations are a form of ownership that is a legal entity separate from its owners. This creates a limited liability for all owners, but results in a double taxation on profits (first as a corporate income tax, then as a personal income tax when the owners take their profits). Corporations tend to have an easier time raising capital then sole proprietors or partners in large part due to the greater sources of funding made available to them, such as selling stock. However, this does result in greater government regulations for corporations, such as requirements for more extensive record keeping. In addition, setting up a corporation is much more difficult, requiring more resources and capital to cover expenses and create legal documentation. This ownership form is best suited for fast growing or mature organizations that have owners looking for limited liability.

Limited Liability Company

A form of business ownership that is taxed like a partnership but enjoys the benefits of a limited liability like a corporation is a “limited liability company”. In comparison to a corporation, it is simpler to organize and does not receive double taxation. While simultaneously receiving more credibility then a partnership or sole proprietor when it comes to gathering resources such as working capital. Unfortunately, this form of ownership is usually reserved for a group of professionals such as accountants, doctors and lawyers.

S Corporation

A lesser known ownership style, an S corporation is a type of business ownership that allows its owners to avoid double taxation because the organization is not required to pay corporate taxes. Instead, all profits or losses are passed on to owners of the organization to report on their personal income tax. This form of ownership does allow for limited liability, similar to a corporation, but without the double taxation. The disadvantages of this organization’s special nature is the increased level of government regulations and the restrictions on the number and type of shareholders it may have. This type of ownership is used in the mature stage of a businesses lifecycle and often by private organizations due to the restrictions on ownership.

Franchise

McDonalds franchise

Franchising is a form of ownership far different from the ones previously mentioned. This form of ownership allows a franchisee to borrow the franchisor’s business model and brand for a specified period. It comes with a list of advantages including: training on how to operate your franchise, systems and technologies for day-to-day operations, guidance on marketing, advertising and other business needs, and a network of franchise owners to share experiences with.

The main disadvantages to this ownership structure are franchising fees, royalties on sales or profits, and tight restrictions to maintain ownership. Franchise owners also have limited control over their suppliers they can purchase from, are forced to contribute to a marketing fund they have little control over. If a franchisee wants to sell their business, the franchisor must approve the new buyer. Despite these disadvantages, franchises are great for owners who are looking for an ‘out of the box’ to owning their own business.

Co-operative

Cooperatives are organizations that are owned and controlled by an association of members. This form of ownership allows for a more democratic approach to control where each share is worth the same amount of votes, similar to a corporation with common stock. It also offers limited liability to its owners and equal profit distribution based on ownership percentage. Disappointingly, the democratic approach to decision making results in a longer decision-making process as participation from all association members is required. Conflicts between members can also arise that can have a big impact on the efficiency of the business. Co-operatives are often used when individuals or businesses decide to pool resources to achieve a common goal or satisfy a common need, such as employment needs or a delivery service.

Advantages & Disadvantages

Below is a summary of the different types of business ownership and the advantages or disadvantages associated with each.

Type of CorporationAdvantagesDisadvantages
Sole ProprietorshipEasy and inexpensive to create
Flexibility and control to your liking
Few Government regulations
Tax advantages if struggling
Profits taxed once
Unlimited liability, meaning business debts are personal debts
Limited source of financing
Limited resources

Partnerships (General/Limited Partnerships)Easy to organize
Combined knowledge, skills and resources
Few Government regulations
Taxed once
Unlimited liability for some partners*
Possible conflict development between partners
Shared profits
CorporationLimited liability
Easier to raise capital due to greater sources of funding
Being taxed twice (as a legal entity and as an owner)
Greater Government regulations to adhere to
More expensive to set up
Extensive record keeping required
Limited Liability Company

Simple to organize and operate
Flexible in nature
Taxed as a partnership

Generally only available to a group of professionals such as lawyers or accountants
S Corporation

Limited liability for owners
Greater credibility for financing
No double taxation

Greater Government regulations to adhere to
Restrictions on number and type of shareholders

Franchise

Superior training and systems offered
Guidance on marketing, advertising, financing, accounting etc.
Franchise networks to share experiences (great knowledge base)

One-time Franchising Fee for owning a franchise location
Recurring royalty fees as a percentage of sales or profits
Tight restrictions that limit control
Purchases must be made from specific suppliers
Contributing to marketing fund, but having no control over it
Selling franchise location requires approval from franchisor

Co-operativeDemocratic control
Limited liability
Equal profit distribution

Longer decision making process
Participation of all members required
Conflict possibility between members
Extensive record keeping required

Every year or two, most of us go to the doctor’s office to receive a check-up on the state of our physical health. The doctor typically checks several measurements (height, weight, blood pressure, etc.) in order to gauge how our health has progressed over the past year. They can then use their results to determine if there is any immediate threat to our well-being or to make helpful recommendations (“you seem to have gained 45 pounds, sir; I suggest you go on a diet”).

Just like we all care about our personal health, managers and investors care about the health of their company. How can they perform a “check-up” on their business in order to determine its progress and financial health? Instead of weight or blood pressure, analysts use financial ratios. We’ll talk about three categories of ratios: profitability, liquidity, and solvency.

Profitability

When a company sells goods or provides services, the money they receive from customers comes in as sales (the terms revenue and sales are interchangeable). However, before they can put it in the bank, there are always expenses that the firm has to pay—wages for employees, marketing costs, taxes, and many more.  Profitability ratios examine what’s left over after paying off those expenses. With each of the following metrics, a higher number is better because it means less money going out for expenses and more retained as profit.

Gross Margin

Gross Margin = (sales – cost of goods sold) / sales

Gross Margin

Gross margin compares the first two lines on the income statement: sales and cost of goods sold. Cost of goods sold is the amount a company spends to obtain the goods they are selling. Let’s say I own a hat company. My cost of goods sold would be the money I spend either buying the hats from a supplier or on the materials and direct labor necessary to produce them myself. For many companies, cost of goods sold is the largest expense.
The main insight we can gain from gross margin is a look at the strength of our relationship with suppliers. If I’m earning a 50% gross margin on my hat business but a rival firm that sells the exact same hats gets a 60% gross margin, I am doing something wrong. I likely need to either renegotiate or find a new supplier that can provide the goods that I need at a cheaper price. A gross margin below industry average is a bad sign for a company and indicates a potential long-run competitive disadvantage.

Operating Margin

Operating Margin = (sales – cost of goods sold – operating costs) / sales

This ratio simply builds upon the gross margin, this time also subtracting out operating expenses. Operating expenses are anything that is involved with the operations of the firm; this commonly includes selling and administrative expense, research and development, and depreciation.

Operating expenses are one area that managers have a greater amount of control through strategic choices they can make. Their goal is to keep operations as lean and efficient as possible by maximizing output from each employee, limiting unnecessary outflows, and tactically designing marketing and R&D spending policies that perform effectively without bleeding the company dry of profits.  Managers are often compensated based upon their ability to cut operating costs.

Net Margin

Net Margin = net income / sales

Net margin gets right down to the most important detail—what amount of our sales are we able to take to the bottom line? To reach net income, we have to subtract out interest expense and income taxes from our previously calculated operating margin.

When comparing companies, net margin is one of the most essential metrics to judge a firm by. Companies that are able to keep greater percentages of their sales as earnings will bring in more money in good times and will be more likely to keep a positive net income in tough economic times. If my hat shop has a healthy 15% net margin and my competitor is at 2%, odds are that in tough times (say, when people are buying less hats and we have to lower prices to drive sales) my earnings will hold up better than the rival, who could quickly shift to actually losing money.

Liquidity

liquidity

Whereas those profitability ratios focused on income statement items, liquidity and solvency are mainly concerned with the strength of a company’s balance sheet. The concept of liquidity centers upon a business’s ability to handle short-term obligations like accounts payable, accruals, and debt that is due within one year.

Short-term liabilities aren’t a bad thing— nearly every company needs to use them to operate—but managers must make sure there is enough cash around to handle them. If $200 million is due in a month and we only have $50 million available to pay it, our company needs to scramble to collect or borrow an additional $150 million or we could go into default. Defaulting is a disaster for companies and can lead to a credit downgrade, higher interest rates, or even bankruptcy if creditors are alarmed and want their money back faster.

To ensure our business avoids such unpleasantries, we need to keep an eye on liquidity ratios.

Current Ratio

Current Ratio = current assets / current liabilities

This is a simple calculation as both current assets and current liabilities are added up for us on the balance sheet. However, it is important to make sure that the current ratio doesn’t dip too low—a higher number is better as it means we have more liquid assets available to counteract our short-term obligations. A current ratio of 2 or higher is often seen as “safe”, but that number varies depending on the company.

The problem analysts should watch for is a major drop in current ratio between one period and the next. If my hat business has a current ratio consistently around 2 from 2012-2016 but this drops to 1.2 in 2017, it could mean something is going very wrong. We may have borrowed too much money, customers might not be paying us on time, or we may have spent too much of our cash reserves on a long-term asset (such as a new factory). As long as the problem is caught early enough, there is usually a way to raise short-term funds through long-term financing and ensure that the business isn’t going to run into any liquidity problems.

Quick Ratio

Quick Ratio = cash and cash equivalents / current liabilities

The quick ratio tells us similar things to the current ratio, except it only includes cash and cash equivalents (which can include money market accounts, short-term securities, or anything else we can quickly turn into cash). The point of this is that current assets besides cash (like accounts receivable and inventory) are riskier than cash itself. If we owe the bank $10 million in a month, they won’t accept $10 million in hat inventory. We would have to hope we can sell that inventory to raise cash, which is not a certainty by any means. Again, a big drop in the quick ratio is the main problem an analyst would want to watch for.

Solvency

Solvency ratios are focused on looking beyond the short term and determining how a company is financially positioned to survive in the long term. This mostly looks at how much long-term debt a business is holding relative to other accounts and the amount of interest expense a firm is shelling out every year.

The stakes are high here. If our company has too much debt and has to spend too much on interest, we are going to go bankrupt. The economic cycle is very important to keep in mind, because what may be an ok amount of debt in good times can quickly turn into way too much in a recession. It’s the analyst’s job to think ahead and make sure that if there’s a downturn and our earnings drop off, we are positioned to survive.

Debt-To-Equity Ratio

Debt to Equity = Total Liabilities / Total Equity

Business is good!
Counting both my inventory and my cash

This is one of the most common solvency ratios that analysts use. Essentially, it shows us a comparison between the amount of debt financing (borrowing) that we use versus the amount of equity financing (for example, selling common stock). Generally speaking the lower this ratio is, the safer the company’s balance sheet. Debt to equity varies widely depending on the company and the industry.

The most useful thing we can do is compare debt/equity ratios across an industry. If the average debt/equity in the hat industry is 1 (equal use of debt and equity) but my business is running at 3.5, there’s a good chance that in a downturn my company will be the first to go bankrupt. Alternatively, if a company has had a debt/equity of 0.5 for the past five years but in 2017 it leaps to 2, investigation needs to be done as to why so much debt was added and whether or not the business can handle it.

Interest Coverage

Interest Coverage = earnings before taxes and interest (EBIT) / interest expense

This is a really useful ratio to see how well a company can handle their interest payments. It tells us how many times we can cover our interest expense (found on the income statement) using our EBIT or operating income. The higher the ratio, the more comfortably we are managing our interest. A major drop-off in the interest coverage ratio means that either we’re earning less or paying out more interest—either is concerning!

Definition

“Price Controls” are artificial limits that are put on prices. If the limit is put in place to prevent prices from getting too high, they are called Ceilings. If they are in place to prevent the price from getting too low, they are called “Floors”.

Price Ceilings

price ceiling
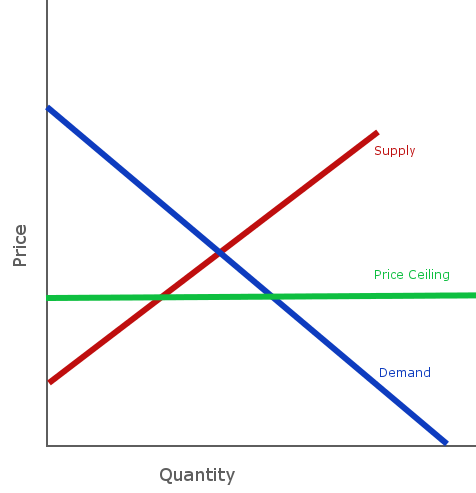
Price Ceilings are controls put in place to prevent the price of some good or service from getting too high. This type of control is most common with food, where there might be a maximum price that businesses can charge for things like flour or electricity.

These controls are put in place to protect consumers and to prevent price gouging, particularly so the poor are able to afford basic goods and services. When there is a price ceiling, suppliers cannot sell above a certain price, and this creates a Market Shortage.

With a Market Shortage, the quantity producers are willing to supply is less than the total quantity that consumers demand at the given price. This can result in rationing, or lottery systems to determine which consumers are able to buy.

In extreme cases, it can result in “Bread Lines”, where essential goods are not supplied in sufficient amounts, so consumers need to join waiting lists to get their necessary share.

Price Floors

price floor
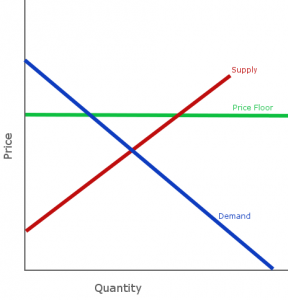
Price Floors are the opposite – a control put in place to ensure that a certain amount of something is produced by making sure producers are guaranteed at least a certain price for what they supply. These types of control are common for milk.

These controls exist to prevent shortages, by making sure suppliers get at least a certain price, it encourages production. When there is a price floor, the producers are willing to supply more than consumers demand at a given price, creating a Market Surplus.

With a Market Surplus, the government needs to buy the excess production, or else the market price will collapse back down. In the case of milk, the government typically buys the excess production and stores it, uses it as part of disaster relief, or tries to sell it on international markets.

Pop Quiz

[mlw_quizmaster quiz=51]

What Is The Business Cycle?

The Business Cycle is the broad, over-stretching cycle of expansion and recession in an economy.

The Business Cycle is concerned with many things – unemployment, industrial expansion, inflation rates, but the most important indicator is GDP (Gross Domestic Product) growth. Below you can see a graph of the GDP growth rate in the United States since 1946 – the grey bars highlight periods of a recession.

GDP growth

The Business Cycle can also be thought of as how Real GDP moves above and below its Potential Levels.

What Is Real GDP?

GDP, or “Gross Domestic Product”, is the total amount of finished goods and services produced in an economy during a given year (for more information, read our full article on Common Economic Indicators). If you just add up the value of all the finished goods and services in one year, you will have the Nominal GDP.

[econ]The most common way to measure inflation is the Consumer Price Index, or CPI. But there are others! Try to find other ways to calculate inflation![/econ]

Unfortunately, you cannot directly compare the Nominal GDP of one year with the Nominal GDP of another year, because the same goods and services change price over time. If we want to compare the GDP of different years, we need to adjust the Nominal GDP by the Inflation Rate. Once you adjust your Nominal GDP by the Inflation Rate between years, you have the Real GDP, which you can use to directly compare different years.

What is the Potential Level of GDP?

The “Potential Level” of GDP is the total output an economy can sustainably produce in a year.  This is the potential output if every laborer is using their skills the most efficiently, with businesses using their capital goods to the best of their design at the current levels of technology, and public institutions are operating at their peak efficiency. Every time workers learn new skills, technology increases that allows us to make new goods (or the same goods but more efficiently), or changes to the government or culture take place that promote economic growth, the Potential Level of GDP increases.

[econ]It is not possible to tell if the economy is growing above the Potential Level during an expansion, but it usually becomes obvious after a crash![/econ]

The Real GDP growth rate swings above and below the Potential GDP growth rate, which is called the Business Cycle.

Running Below Potential Levels

It is easy to see how an economy can be running below the potential levels – if workers are not matched with jobs that make the best use of their skills, or if machines are not properly maintained, or even if the government has poor leaders that make less-than-optimal laws and policies, it will cause the Real GDP growth rate to fall below the potential level. If it falls too far below, the economy could enter a Recession. Inflation is usually low when an economy is running below its potential levels.

Running Above Potential Levels

The economy can also run above Potential Levels. Remember – the Potential Level is based on what can be sustainably produced. This means that if current growth levels are the result of over-borrowing, or asset bubbles, output might actually be growing at a higher-than-sustainable rate. Economies very often run above their potential levels for short periods of time with no problems, but going too far above for too long can result in a crash. Inflation is usually higher when the economy is running above its potential, which serves to bring the Real GDP back down to its potential levels.

Expansions and Recessions

When the GDP growth rate is positive and unemployment is relatively low, it is called an Expansion. If the GDP growth rate is very low or negative, with higher unemployment, it is called a Recession.

Economic Expansions

stock broker
This part-time lifeguard would prefer to be a full-time stock broker

Most of the time, the economy is an “Expansion” phase. This does not mean everyone is doing well – even during very strong expansions, the unemployment rate usually stays around 5% (meaning 1 out of every 20 people who wants a job can’t find one), with the underemployment rate (people who are working part-time but want a better job) is usually much higher.

What an Expansion does mean is that new jobs are being created, and the total value being produced by an economy is going up. Growth also promotes growth – the more resources that are available, the more resources can be allocated towards researching new technologies and building new skills.

Economic Recessions

Recessions typically occur every 7-15 years, often following an asset bubble bursting, followed by a large loss of value in an economy. Recessions typically have higher levels of unemployment, with low or negative GDP growth. Even if GDP growth is never negative, recessions hurt. Other than GDP, the biggest indicator of a recession is a sharp decrease in consumer spending, and inflation tends to fall.

Higher unemployment rates mean that people lose their jobs, and new workers have a hard time finding their first position. Losses in the financial sector hurt retirement accounts and individual savings and investments, which can severely disrupt life plans. Thankfully, recessions are temporary, and the business cycle can usually move back into an expansion phase fairly quickly.

What are Credit Cards?

Credit cards is a form of unsecured credit (meaning a loan without collateral) that you can use to make everyday purchases. All credit card purchases are made using a loan – you borrow money from your credit card issuer, and later pay it back with interest.

Credit Cards Vs Debit Cards

credit card

Credit cards can be used at all the same places as debit cards. In fact, some business only take credit cards (like most car rental companies and many hotels) specifically because it works as a line of credit – a business accepting a transaction from a credit card knows it will be paid immediately. If you have both a debit card and a credit card, you should choose carefully which you use most for your everyday transactions.

Advantages over Debit Cards

There are some good reasons to use credit cards for every-day purchases instead of your debit card:

  • Your debit card may have a transaction limit or transaction fees – credit cards typically do not
  • Credit cards often offer “Cash back” and other rewards programs for most purchases
  • Credit cards are accepted more widely than debit cards (especially if you are travelling overseas)
  • Using your credit card will build your credit history, which can lower your interest rate and increase your credit limit on other loans
  • You can “Float” credit card purchases, using it as a short-term loan before your next paycheck

Disadvantages over Debit Cards

There are also some good reasons to use your debit card instead of a credit card:

  • If you miss your grace period, your purchases will be charged interest with a credit card, making them more expensive
  • Since you do not need to pay the full balance on credit card purchases every month, it makes it easier to over-spend
  • If you start to fall behind on your payments, it can be very difficult to fully escape credit card debt
  • Credit card billing cycles are usually 20-25 days instead of one month, making it more difficult to schedule payments compared to other types of bills.

Credit Balance Types

When you use your credit card, there are several different types of balances that will appear on your credit card statement:

New Purchases

Your new purchases are the things you’ve bought using your credit card during the current billing cycle. You will not be charged interest on this balance until the end of your grace period, so it is usually a good idea to pay off this balance first and avoid finance fees. If you miss your grace period, you will be charged interest on the balance for every day you had it.

Balance Transfers

If you don’t pay off all your purchases in a month, the remaining balance will carry over to the next month as a Balance Transfer. Balance transfers do not have a grace period, so they will accumulate interest for the entire billing cycle.

Cash Advancesincome

This is the most expensive type of charge you can make on your credit card. Cash advances are when you take money out of an ATM using your credit card. Cash advances also typically do not have a grace period, and they usually have a higher interest rate than balance transfers.

Finance Charges and Interest Rates

Credit card companies have finance charges as a condition to using the credit card – the most important one is your interest rate.  Each one of your balance types has a different way interest is charged

How Interest is Calculated

Different credit cards may calculate the interest you owe differently, and this difference might make a big difference on your bill. The two most common methods are “Daily Balance” and “Average Daily Balance”.

Previous Balance

The previous balance method uses your balance at the beginning of the billing cycle to calculate your interest. This means that payments you make during the billing cycle will not lower your total interest payment, but will only impact your bill next month.

Adjusted Balance

This method is similar to the previous balance, but also subtracts any payments you make. This method gets you the lowest total interest charges, but is very rare for credit card companies to offer it.

Ending Balance

The ending balance adds your balance transfer to all the charges you made during this billing cycle, and subtracts any payments you made. The interest is then calculated based on that final total.

Average Daily Balance

This method is the most common. Your credit card company takes the average balance of all days and multiplies that by your daily interest rate, then adds it together for every day in the billing cycle.

Grace Period

Every credit card has a grace period, usually about 21 days. If you pay off any new purchases within 21 days of making them, you will not get an interest charge for those purchases. If you miss the grace period, you will be charged the full interest amount. There is no grace period for balance transfers and cash advances, so you will be charged for every day you have a balance outstanding on these balances.

Minimum Payments

Your credit card will have a minimum payment every month, which is the absolute least you can pay to keep your account in good standing. Your minimum payment is based on your outstanding balance. The payment is generally enough to pay off new interest, plus some of the principle balance.

Just making the minimum payments is the absolute longest way to pay off credit card debt, and it will result in the absolute highest possible amount you pay in interest.

Note that there are some conditions that can cause your minimum payment to be less than interest, in which case you will never fully pay off the debt. If your minimum payment is lower than or equal to your interest charge, you can continue making payments on interest forever without ever paying off your debt.

credit card debt

Missing Payments

Missing your credit card payments can result in defaulting on your account. Defaulting on your account has a few impacts:

  • If you had any promotional interest rate, you will retroactively lose it (meaning all your previous outstanding balances will now use the higher interest rate instead of the promotional rate, making your bill even higher)
  • You will get “Late Payment” fees, which is added to your balance transfer into the next billing cycle
  • Missed payments are reported to the credit reporting agencies and will lower your credit score
  • Your credit card may also lower your credit limit and increase your interest rate

If you miss a certain number of payments, your credit card may cancel your line of credit entirely, and send your case to a collections agency. This will further damage your credit score, and make it extremely difficult to get any new credit cards or loans for the next several years.

The CARD Act of 2009

In 2009, the federal government passed the Credit Card Accountability, Responsibility, and Disclosure Act of 2009, which bans certain types of behavior from credit card companies. It also gives credit card holders more tools to help keep their credit cards in good standing.

The CARD act bans credit card companies from:

  • Increasing your interest rate on existing balances (so if your rate goes up, it only applies to new purchases). This doesn’t apply to removing promotional rates
  • Your interest rate cannot go up in the first year of holding your account (except if you have a variable rate credit card, then your base rate can’t do up but the variable rate can)
  • Processing your payments late (all payments must be processed on the day they are received)
  • Charging fees for different methods of payment
  • Using a double billing cycle (where you would be charged interest based on the last period’s balances instead of just the current period)
  • Issue credit cards to people under 21 without a co-signer

As the card holder, you also get new rights with your credit card:

  • If you default on one credit card, credit card companies can’t automatically charge you a higher “penalty rate” on other cards you have
  • You have at least 21 days after your bill is mailed to pay it without any interest charge
  • If you pay more than the minimum payment, all the extra is paid towards your balance with the highest interest charges first (so if you make higher than the minimum payment, the extra would go towards your cash advances before your balance transfer)
  • You can opt-out of over-the-limit fees. If you do, trying to charge more than your credit limit would result in a declined transaction instead of letting it go through with a fee
  • You can opt-out of interest rate increases. If you do, your credit card will be cancelled once you pay off your balance (this might impact your credit score).

If you want to start building your first workable budget, it is important to know exactly what should be in it, how to keep it updated, and the specific reason you want to have this budget.

What does a budget look like?

spreadsheet

A budget is usually a spreadsheet or table. On one side or column, you will list your planned expenses, while on the other side you list your planned income.

You can use a budget for many different things, depending on the budget type. Using a mix of different budget types, as each situation finds appropriate, can be one of the most effective ways to reach your short term financial goals.

Budget Types

There are two types of budgets, each of which has its own place in your personal finance toolkit.

The Project Budget

A project budget is something you make just once for a specific purpose. For example, you might make a single-use budget when evaluating apartments you might move to (outlining costs of rent and transportation between a few different alternatives).

The project budget is the easiest budget to make because you do not necessarily need to keep managing it in the long term – this is a “one and done” way to address a specific problem.

The first budget most people make is a project budget to help look at their current expenses and see what adjustments need to be made. The problem with this approach is that project budgets work very well for short-term thinking, but tend to be difficult to follow for longer periods of time.

Project Budget Components

Your project budget is looking at a snapshot in time. This means you are comparing some known fixed expenses to a specific amount of income or money you can dedicate towards paying for it. The specific components are:

  • Itemized list of known expenses for this period in time
  • Total expected income or starting cash you have to allocate to this period in time
  • Surplus – the total income minus the total expenses.

The purpose of the Project Budget is to maximize that surplus, or the money you have left over to allocate to other things.

Common uses for a Project Budget

  • Comparing alternative apartments (building a sample budget for each alternative to compare)
  • Planning a vacation
  • Paying off short-term debt
  • Other short-term crisis or goals

The Living Budget

Unlike the Project Budget, a Living Budget is meant to “grow” and adjust over time. These budgets are not designed for a specific goal or purpose, but instead to help you keep a general idea of where your money is going from month to month, and help you adjust your spending to reach your financial goals.

One of the major differences with a Living Budget is that while you make them looking forward, you also should look back regularly and make adjustments (not start over as needed).

Living Budget Components

grocery bill

Your living budget needs to be regularly adjusted and updated. To set up an effective living budget, you will need the following components:

  • Regular monthly income (things like your paycheck)
  • Variable income (gifts, one-off payments, ect)
  • Regular monthly expenses
  • Regular contributions to savings or other financial goals
  • Expected variable expenses

Using Your Living Budget

Unlike the Project Budget, the goal of the living budget is not necessarily to maximize your surplus. Instead, your Living Budget has your savings and other financial goals built in, and you can adjust these every month or two along with your variable expenses.

With your Living Budget, having a big surplus every month is not necessarily a good thing, since that might be a sign that your financial goals might be set too low.

Expense Categories

With the Living Budget, you will notice that there is a difference between “regular”, or fixed, income and expenses with the “variable” income and expenses. When you set out to outline your budget, it is important to keep these distinctions separate.

There are 2 types of expenses, which each have 2 flavors.

  • costsTypes:
    • Fixed Expenses
    • Variable Expenses
  • Flavors:
    • Needs
    • Wants

Most people new to budgeting only consider needs and wants, but without fully breaking down where your money is going, it will be much harder to build a workable budget.

Category Breakdown

Each category has its own place in your budget, and when you want to reach a specific savings goal, these separations make it much easier to hit your targets.

Fixed Needs

Your “Fixed Needs” are things like paying rent, utilities, car payments, and groceries. These costs should not change very much from month to month.

When you are engaging in short-term financial planning, there is not much you can do to change your Fixed Needs expenses. With mid-term and long-term planning, finding ways to cut down or reduce these costs (or any increases to them, like getting a better apartment or car) will likely make the biggest changes impacting your long-term goals.

Fixed Wants

coffee

Your “Fixed Wants” are the costs that add up quickly over time, but most beginners frequently forget to include in their budgets. This includes things like morning coffee from Starbucks, going out for lunch with your friends or co-workers instead of bringing lunch from home, having dessert after dinner, and any other regularly-occurring expenses.

Your “Fixed Wants” include all the little pleasures or extras that you normally get in your day-to-day life – things that you know you could probably live without, but removing them would really sour your days.

Variable Needs

Your “Variable Needs” are expenses that are important, but you may not have them every month. This includes the extra money you will probably spend on heating in the winter, or semi-annual visits to the dentist, or Christmas/birthday gifts for friends and family.

Unlike your Fixed Needs, even with long-term financial planning, there probably will not be very much you can do to change your Variable Needs costs in the long run – you will always need heat in the Winter, always need your teeth fixed when they break, and always need oil changes on your car.

Variable Wants

“Variable Wants” are your expenses that come more “spur of the moment” – things like a night out for drinks with friends, shopping for some new clothes, or buying a new video game.

You usually will not be able to make a line-item budget for your variable wants, but you can estimate how much you spend each month based on your receipts and account reconciliation from the previous month. Once you know how much your Variable Wants are costing you, the next step is taking steps to make sure those costs are under control.

How To Use Your Living Budget

When you are making your Living Budget, you should do so shortly after your latest account reconciliation, where you lay out your 10 or 20 biggest purchases over the last month and consult your bank account. You may know off hand how much you spend on rent and electricity, but building realistic estimates for your variable expenses (both wants and needs) means you need to look at exactly how much you are already spending.

Once you have your expense breakdown from the previous month, you can build your budget for moving forward. This means setting some specific financial goals:

  • Deposit $300 per month into your savings account
    • This means you need to already have a surplus of $300, or make a separate goal to get this money from somewhere else
  • Reduce Fixed Wants costs by $50 per month by brewing your own morning coffee 3 times per week
  • Increase surplus by $100 per month to afford a nicer apartment
  • Reduce Variable Wants costs by $75 per month, and apply that savings towards a yearly vacation savings fund

Putting Your First Goals Into Practice

coins-currency-investment-insurance-128867

To help make sure you hit your savings goals, split your “Savings Targets” in half for your budget. One half should go into your “Fixed Needs” category – this is money you are setting aside as soon as you get paid. The other half should be filed as a “Variable Want”, meaning a target you are setting, but until you have a few months of practice adjusting your budget, you might not be able to reach.

One common problem beginners face is combing both of these items together, then simply trying to increase their surplus by the amount they want to save per month. This tends not to work, simply because there is no concrete line item that you can admit to not reaching – it becomes easy to just roll over that goal by saying “I can just save more next month to make up for it!”.

By separating your first goal into smaller parts, it makes both parts easier to obtain. Having the fixed necessary savings means that you will make progress towards your goal even if everything else goes poorly, while the second half works as an extra incentive showing you have effective money management.

As you become more experienced building your Living Budget, you can shift a bigger percentage of your savings goals into your Fixed Needs category to have more stability, and more effective planning for the future.

If you want to start building your first budget, click here to try the Home Budget Calculator!

If you have ever wanted to protect your portfolio on HowTheMarketWorks from losses, you have definitely used Stop Orders. The biggest downside of stop orders is, of course, the fact that you have to constantly update them as your investments grow to “lock in” your gains…

What are Trailing Stop Orders?

Trailing Stop orders work a lot like regular stop orders evolve with the market. This means you can set a Trailing Stop sell order to sell if your stock’s price falls by $2.00, or even 2%. As your stock’s price grows, the trailing stop price goes up with it. It will only execute when the stock’s price falls by your Trailing Stop threshold from its peak – meaning you lock in your gains without constantly updating your stop orders.

How Does It Work?

Good question! Check out our tutorial video below to see how to use Trailing Stops with your portfolio.

Crude oil prices have been climbing up steadily in the last couple of months as investors continue to expect a balance in the demand and supply dynamics of oil. Last year, OPEC announced that it has worked out a deal with its member nations and some other producers to cut production volumes in order to force an increase in oil prices. Data on oil output in January shows a 90% compliance level among member nations as the promised production cuts become evident. Russia and other non-member nations have also started reducing their output to uphold their ends of the deal.

Oil prices started falling some two years ago after an increase in the supply of oil and a decline in the demand shifted the dynamics of oil trade. The entry of U.S. shale oil and the return of OPEC producers such as Libya and Iran caused the supply of oil to surge. To OPEC’s credit, last year’s deal to reduce the supply has shown that the cartel is not a toothless dog and investors are more optimistic about the prospects of oil. This piece seeks to provide insights into what commodity traders can expect from crude oil going forward.

Oil prices are on a bullish rally

Stakeholders in the global energy industry are optimistic that oil prices will rise – commodity traders must pay attention to this rising bullish sentiment. Since OPEC announced the deal to cut output on November 30, 2016, Brent Crude has gained an impressive 12.93% and the West Texas Intermediate has gained a decent 7.18% as shown in the chart below.

At the start of the new week ending February 24 crude oil was up across the board. April contracts for the Brent crude oil had gained 0.49% to trade at $56.08 per barrel.  March contracts for the U.S. West Texas Intermediate was booking gains of 0.32% to trade at $53.95 per barrel.

The aforementioned gain in oil prices is particularly interesting and impressive because investors and traders are bullish even though U.S. producers could erase the production cuts from OPEC by flooding the market with more shale oil. Peter Sawyer, an analyst at Stern Options observes that “an increase in U.S. oil is a worrisome move that could potentially sustain the supply glut and water down the effects of the production cuts that OPEC is celebrating.”

Analysts at Goldman Sachs have observed that U.S. current oil rig count and been increasing for five straight weeks and the increase suggests that U.S. output could increase by 130,000 barrels per day this year. The U.S. Department of Energy also echoes the same sentiments about an increase in U.S. oil output. The Department of Energy notes that U.S. oil production could climb to 9 million barrels per day up from 8.9 million barrels per day in 2016.

In essence, stakeholders must contend with the realities of OPEC’s output cut on the one hand and rising U.S. output on the other hand. However, the fact that global oil prices are rising despite the two sides of the market coin suggests that investors are betting on increased bullishness ahead.

Final words

Crude oil is currently enjoying bullish tailwinds because investors are rewarding OPEC with goodwill for pulling off the historic deal to cut oil output. In fact, investors are starting to place speculative trades on the increased bullishness of crude oil. Bloomberg’s CFTC NYMEX crude oil net speculative positions have soared to another record high of 557,570 after gaining 29,704 points. Of course, there’s the attendant risk that crude oil could suffer a massive crash if OPEC loses its bullish goodwill. However, crude oil should continue to rise going forward inasmuch as OPEC continues to record an impressive level of compliance in the deal to cut oil production.

Do your students have a hard time getting started with their portfolio? Do you want a place where you can see all your tools in one place? Us too, which is why we added the new Dashboard to HowTheMarketWorks!

dashboard

The dashboard is just the newest addition to our new design, with your entire suite of tools at your fingertips.

We have divided up all the tools into 5 categories:

  • My Portfolio – here you can find things you own, your assignments, account balances, and graphs
  • Trading – Make a trade, or see your transaction histories
  • Contests – See your ranking, join a new contest, or create your own
  • Research Tools – Start doing some investment research, with a wide range of tools to choose from
  • Trading Ideas – See the most popular stocks and mutual funds, what the brokers are saying, and a lot more

We have more great new features coming, so stay tuned!

Gold Chart

Gold is currently trading at $1,215.85 per ounce, up 0.96% or $11.55. The precious metal has gained 6.40% over the past 30-day period, up $72.40. For the year to date, gold is up 4.7%, and it has an average return of 10.7% since 2002. Its best year on record in that time is 2007 when the price advanced by 30.9%. It should be remembered that gold is a safe-haven asset that thrives during times of geopolitical uncertainty. The recent appointment of Donald Trump to the presidency has had a jarring effect on financial markets. In the run-up to the election, and the immediate aftermath Wall Street equities rallied.

Indices, Currencies, FX and Commodities

The Dow Jones Industrial Average is hovering around the 20,000 level, and sharp gains have been reported with the S&P 500 index, the NASDAQ Composite Index and other minor indices. However, the rally appears to have faded somewhat after Trump’s inaugural address. The USD has been casualty number one after comments made by Trump to various newspapers to the effect that the greenback is overvalued and this is detrimental to US economic growth. An immediate selloff in the USD ensued, and this is evident in the currency cross-exchange rates of major pairs, minor pairs and exotic pairs.

  • The USD/EUR pair is down 0.3426% or €0.0032 at 0.9308
  • The USD/GBP pair is down 0.87% or £0.01 at 0.8012
  • The USD/JPY currency pair is down 1.23% or ¥1.402 at 113.193
  • The USD/CNY currency pair is down 0.31%, or CNY 0.02, at 6.8513

Dollar weakness is confirmed across multiple currencies, and the US dollar index. The vaunted DXY is trading 0.40% lower, down 0.40 at 100.23, slipping away from its 52-week high of 103.82. The index has a 52-week low of 91.92. The DXY measures the performance of the greenback against 6 major currencies including the JPY, EUR, CHF, GBP, CAD and SEK. The most heavily weighted currencies in the DXY are the EUR at 57.6%, the JPY at 13.6% and the GBP at 11.9%.

The Gold Price and the Greenback

The recent weakness in the USD was met by increasing demand for gold, which makes sense. However, as a dollar-denominated asset, gold has also moved independently of the USD. The main driver of gold demand is speculative behaviour and investment activity on major funds like the GLD SPDR Gold shares on the New York Stock Exchange. This ETF is the most important gold fund in the world. This fund is valued at $31.225 billion with 809.15 tonness of gold under its control. Any major capital inflows into this fund naturally fan out into the markets raising the price for gold bullion. In much the same way, any major outflows from GLD will negatively affect the gold price.

The Gold Price and Interest Rates

The gold price has an interesting relationship with interest rates. If rates rise, gold loses favour. The rationale behind this is simple: gold is not an interest-bearing asset. This means that the opportunity cost of holding gold when interest rates are rising is high. Since gold does not pay interest, investors tend to shy away from gold when rates are rising. Instead, they plow their money into fixed-interest-bearing securities such as treasuries, certificates of deposit or savings accounts. The Fed is expected to increase interest rates at least 3 times in 2017. The FOMC will convene again on Wednesday, 1 February, but no rate hikes are expected at this juncture.

While analysts will be cautioning market participants about the impact of rising interest rates (the federal funds rate), many opportunities exist for gold traders in the futures market. Analysts point to important educational resources such as CreditLoan.com for didactic insights into accessing credit in a tightening economy. Interest rates are expected to rise by upwards of 0.75% by the end of 2017, and this will have far-reaching implications for commodities like gold, home loans, personal loans, and overall economic activity. When the costs of capital are higher, the money supply diminishes. It will be interesting to see whether the current long-term trajectory of gold continues and the precious metal continues to lose value.

Travel Money

People buy foreign currency for many reasons. You may wish to purchase Forex as a hedge against depreciation, or because you are traveling abroad. Many people buy foreign currency to send to someone else who is living abroad. Whatever your reasons for buying or selling Forex, you will always want to pay the lowest possible charges.

Banks have been found to be the most expensive way of buying foreign currency. Not only do banks levy high charges on sending/receiving domestic or international wires, they also charge premium rates for converting currencies.

As such, currency exchange companies have sprung up all over the world. These companies effectively reduce or eliminate wire transfer fees and associated high commissions, and offer travelers the best possible rates on currency exchange. There are many options available to you when taking currency abroad. Experts advise travelers to use credit cards with no foreign transaction fees. It is ill-advised to use such cards at automatic teller machines (ATMs) since extortionary charges will be levied by the foreign bank ATM and your home bank. Cash advances will quickly eat into your capital and erode it away.

What Is the Problem with Conventional Currency Transfer Services?

Forex

When you order foreign currency through your bank, you are going to be hit by fees, commissions, and other costs. If you choose to go via banks, do it online. In-bank currency purchases are more expensive. Banks have the added advantage of preferred borrowing rates since they deal with huge sums of money daily. They can get currency for their customers at better rates, but again they tack on many additional charges that you won’t be paying elsewhere.

If you withdraw cash from your bank’s branches overseas, you will also be hit with fees in the region of 1% – 3% if it is an in-network ATM. For these reasons, you will want to compare travel money rates before you part with your hard-earned cash. You may also need to pay international transactions fees which will necessitate fewer trips to the ATM and bigger withdrawal amounts each time. This is a security risk and a costly option.

Why Is the UK Leading the Way with Currency Exchange?

The United Kingdom is the epicenter of the Forex market. The City of London in particular is where the bulk of global Forex trading takes place. As such, the UK has many top-tier money transfer services available. These are highly regarded and oftentimes provide far superior service than the big banks. It is always a good idea to research the money transfer providers available on the market.

These include John Lewis Travel Money, Travel FX by Global Reach Partners, TorFX, FairFX Travel Money Rates, The Currency Club Travel Money Rates, Covent Garden FX Travel Money Rates and many other reputable providers. The providers in the UK operate under the rules of the Financial Conduct Authority (FCA), and HM Revenue and Customs. As such, clients can rest assured that all operations are legitimate with these reputable service providers. Outside of the United Kingdom, banks typically run the show. This is quickly changing in the United States and Canada where many alternative money transfer services are now available

What Is the Best Way to Exchange Money When You’re Going on Holiday?

The tide has shifted from banks to reputable money transfer providers. In the UK, there are a myriad of highly regarded providers that offer better services and rates than banks. Banks typically buy currencies at the best rates, but charge customers much higher rates. This is pure profit. The wire transfer fees for incoming and outgoing wires at banks are extortionary. As such, your best bet is to evaluate the rates at top UK providers, and compare them based on your preferences.

Money transfers for personal use such as going on vacation are going to be smaller than for setting up a new business. Therefore, you will want to ensure that your currency exchange rate is favourable, and that’s where flexible currency purchases by money transfer providers beat the banks. They will wait for you to get the best rates before initiating currency purchases. Banks simply purchase the currency as soon as you seal the deal. Shop for the best rates before you consider going to banks.

HowTheMarketWorks is growing – and the list of great educational articles you can include in your class assignments is growing too!

creditcard

Last week we added 3 new Personal Finance and Investing articles, plus one great new personal finance calculator!

New articles

New Calculator

We add new articles to the Education Center every week, but when we add new items to the Assignments, you know they are special!

Articles we add to Assignments can be integrated with your HowTheMarketWorks contest – you can assign these as reading to your students, and track their progress. These articles have been written to cover topics that are part of the National Standards for Personal Finance and Economics, part of the Common Core curriculum.

Click Here to learn more about assignments!

2016 Presidential Poll of College Students

Presidential Poll of College Students Trump Leads by 3.4%

Presidential Poll of High School Students Trumps Leads by 19.1%

Stock-Trak Inc., the leading provider of educational stock market simulations for the high school and college markets, posted polls on its websites from November 1 to November 3 asking its users for whom they would vote.  Participation in the polls was optional, the strategy was admittedly unscientific, but the the results were amazing.

Our www.StockTrak.com site is used in over 1,100 college finance classes and by 75,000 students each year.  The demographic tends to be slightly more males than females, and roughly 75% undergraduate students, 23% graduate students, and 2% other.


Our www.HowTheMarketWorks.com site is used by a mix of middle school, high school, college and adults clubs that want to learn about the stock markets and practice trading.  The middle school classes using HowTheMarketWorks.com tend to be Math or Social Studies; the high school classes are mostly Economics, Personal Finance, and Business; and the college classes are mostly Finance or Economics classes.

Based on the self-reported age, users over 18 years old were directed to one Presidential Poll and users under 18 were directed to another Presidential Poll.

During the 3 days of November 1 to November 3, 2016 9,467 users 18 years old and over completed one poll and 11,885 students under 18 years old completed the other poll.  The 2 results are as follows:

StockTrak.com and HowTheMarketWorks.com 2016 Presidential Survey

(for users 18 and over)

Democrat – Hillary Clinton: 3,363 votes or 35.5%

Republican – Donald Trump: 3,678 votes or 38.9%

Libertarian – Gary Johnson: 857 votes or 9.1%

Green – Jill Stein: 453 votes or 4.8%

Other:  996 votes or 10.5%

The “Other” votes included responses such as Bernie Sanders, Me, Romney, Paul Ryan, Dak Prescott, and ‘Thankfully not American!.’  Watching the voting throughout the day revealed an interesting trend.  During the day when the stock markets were open, Trump seemed to stretch his lead.  However, the evening and overnight votes pulled Clinton back closer.  “This was a consistent trend for each of the 3 days,” said Mark T. Brookshire, Stock-Trak CEO and Founder.  “Perhaps this pyscho-demographic trend suggests that the students who were actively managing and monitoring their portfolio during market hours leaned Republican while the more passive investors leaned Democrat.”


StockTrak.com and HowTheMarketWorks.com 2016 Presidential Survey

(for users under the age of 18)

Democrat – Hillary Clinton: 2,935 votes or 24.7%

Republican – Donald Trump: 5,207 votes or 43.8%

Libertarian – Gary Johnson: 948 votes or 8.0%

Green – Jill Stein: 576 votes or 4.8%

Other:  1719 votes or 14.5%

The “Other” votes for this age group were what you might expect with answers ranging from Bernie Sanders to Obama to Mickey Mouse.  “I was amazed that so many students would voluntarily take our Presidential Poll, but I am at a loss to explain why our poll of users under the age of 18 would be so strong for Trump,” says Mr. Brookshire.  “Perhaps its because of the strong selection bias of our high school users being from Economics, Personal Finance and Business classes.”


For  more information, please contact Mark T. Brookshire at Mark at StockTrak.com or 770-337-7720

Our Back To School Challenge is now finished, we had tens of thousands of trades placed to fight for the top spots! See the winners below! If you want a shot at a cash prize yourself, join our next contest!

Stock Trading Contest Result

  1. Fractals7                                                     
  2. Namburiv
  3. Catspaws
  4.  Igorski123
  5. MichaelGebhart

See The Trading Strategies From This Contest!

Janene’s March Trading Strategy - Contest: March Trading Contest Final Portfolio Value: $131,022.78 Trading Strategy For This Contest I’ve watched the market as it fluctuates, learning to buy and short gold as it adjusts. I tend to go with my gut instinct when buying stocks. Sometimes it works, sometimes, not so much. The best thing you can do, to help you Read More...
Vicky’s March Trading Strategy - Contest: March Trading Strategy Final Portfolio Value: $101,169.24 Trading Strategy For This Contest Trading Strategy: Investing for the first time in the stock market is very overwhelming; even if it is done with virtual money. I’ll start saying that implementing a strategy takes a lot of practice and patience. You must begin understanding some of Read More...

About The Challenge

We held trading contest from September 5 through September 30, 2016, with over 4,000 traders joining in! We gave prizes to the top 5 finishers. This was the fourth prized contest of 2016!

Prizes

  • Top 5 Finishers Each Win $100

Rules

  • There will be a full audit at the end of the investing contest on all winners to verify any corrections due to stock splits, dividends, or any other corporate action our team may have missed. Only legitimate portfolio returns will be counted in the ranking.
  • Each person is allowed only 1 entry. Users with multiple portfolios in the contest will be disqualified.
  • The usernames of the winners will be made public, but not their actual first name, last name, nor email address.
  • No member of the HowTheMarketWorks Team is eligible for any prizes

What Is Credit?

“Credit” is when you have the ability to use borrowed money. This can come in many different forms, from credit cards to mortgages. There is a wide range of ways to use credit, which means that it is often a challenge for beginners to learn all the different ins and outs of using credit.

Basic Credit Terms

Before diving in to how each piece works together, you should know some of the basic terms that come up a lot with credit.

Principle

This is the amount of money that you need to re-pay. This includes the amount you originally borrowed, plus any extra interest.

Interest Rate

This is how much you are charged for the right to use borrowed money. This is an annual interest rate.

Credit Limit

Your credit limit is the total amount you are allowed to borrow.

Grace Period

This is the time between when you borrow money and when interest begins to be charged on the principle.

Minimum Payment

This is the least amount you can pay back per month before your credit card company considers you defaulting on your debt. This is a percentage of your total principle balance.

How Does Credit Work?

Credit works based on trust. You, as the borrower, ask a lender for a “line of credit”, or the ability to borrow money to use for your own needs, and you promise to pay it back. The lender will agree, with certain terms and conditions. These terms are generally based on what you intend to buy, how likely you are to make all repayments on time, how trustworthy you have proven yourself in the past with borrowed money, your income, the overall conditions of the market, and a few other factors.

At the end of the day, the more trustworthy you have proven yourself to creditors, the better terms you can get when borrowing money, because they see it as a lower risk. If creditors do not see any reason to think you’re trustworthy (or if you have proven yourself untrustworthy in the past), you will get worse terms.

What Are My Credit Terms?

Your credit terms refers to how much you can borrow, and how expensive it is to borrow. Having “Good Terms” generally means higher credit limits (meaning you’re allowed to borrow more money at a time), lower interest rates (making it less expensive to borrow), and other perks like cash back and flight miles. For beginners, focusing on lower interest rates should be your biggest concern when shopping around for credit cards or car loans.

How Can I Improve My Terms?

Since your credit terms are determined by trust, the best way to improve your terms are by using credit and reliably paying it back. This shows creditors that you are able to manage regular payments and will very likely be able to pay back your borrowed money on.

From a creditor’s point of view, every time they lend money it is an investment. Their return on investment would be the interest rate you are charged to borrow money, while their risk is the likelihood you are not able to pay back on time, or not at all. If you have shown that you can reliably make your payments, they believe you’re a safer investment, and so you get better terms. If they don’t have much credit history, or (worse) a credit history with lots of late or missed payments, they see you as riskier, so they charge more to use the service.

Creditors use credit reports to share information with each other about who does, and who does not, pay their bills, so you won’t be able to get out of a bad credit history by switching to a different lender.

Credit In Practice – A Credit Card

When you use your credit card to buy something, say a television at $300, you open a new principle balance for $300, which you borrow from the credit card company. You can only borrow up to your Credit Limit, we will assume your credit limit is $300 in this example so the TV used it all up.

The credit card company then gives you a Grace Period, or time between when you first make the purchase and when they start charging you Interest. The grace period is usually 3-4 weeks, but this can vary a lot depending on your credit card company [rich]The Grace Period is another important term to know when shopping between credit card companies![/rich]

After the Grace Period ends, the credit card company will start charging you an Interest Rate. The interest rate is a percentage of the principle balance that is added as a charge – this is the primary cost of borrowing money. The Interest Charge is added to your Principle Balance.

You will need to make at least your Minimum Payment every month in order to remain in good standing with the credit card company. The minimum payment is a percentage of the Principle Balance, but beware – if your minimum payments are less than the amount being added by interest and fees, you will never fully pay off your debt. Many young people have been stuck paying off relatively small credit card debts for many years by only making the minimum payments, meaning they ended up paying many times extra in interest more than they originally borrowed! You can always pay more than the minimum payment.

As you make payments to reduce your principle balance, you can use the difference between your principle balance and your credit limit to continue making extra purchases on your credit card.

Once your principle balance is zero, no more interest will be charged, and you will be back to the beginning. To see how this works out, check out our Credit Card Payments Calculator.

Credit In Practice – A Mortgage

house

If you need to buy a house or property, you will have a mortgage. The biggest difference between a mortgage and a credit card is that with a mortgage, you are borrowing the money for a very specific purpose, usually to buy a house. The house you are buying then becomes collateral in the loan, meaning that if you fail to pay back, the creditor can take your house.

This risk of losing your house works both ways – it also means that your creditor has a lot lower risk in lending you the money, since they are able to claim something back if you aren’t able to repay. This means that with a mortgage, you will have much higher credit limits and better interest rates than a credit card, even with the same credit score and credit history.

Otherwise most of the mechanics are the same as a credit card – minimum payments, interest and principle all work the same.

Unlike credit cards, there are two types of interest rates used with mortgages, Adjustable and Fixed.

Fixed-Rate Mortgages

Fixed-Rate mortgage is how it sounds, the mortgage interest rate is fixed for the entire duration of the mortgage. This means your rates and payments will be predictable for the entire duration of the mortgage. As a trade-off, fixed-rate mortgages might be (on average) slightly higher than adjustable.

Adjustable-Rate Mortgages

With an adjustable-rate mortgage, your interest rate can move up and down over the term of your mortgage based on the overall market rates. Lenders prefer these – it means they can increase or decrease how much they’re charging based on prevailing market rates.

For lenders, you lose some predictability in your payments. However, to compensate, banks generally offer lower average adjustable rates than fixed rates (but this may not always be the case).

What Else Impacts My Credit?

There are a lot of other factors besides your credit history that will impact your credit and payments. The biggest of these can be the “Extra fees”, or money credit card companies charge for using certain services. These can be tricky and add up fast.

[rich]The most common extra fee is to receive a paper statement in the mail rather than by email. You might also be charged a “service fee” even if you don’t use your card.[/rich] Fees vary widely, both in type and amount, between credit card companies, so should definitely be on your list of things to check when shopping around.

Other factors are more mundane, like your income and the general market. If you earn more money, you will likely have higher credit limits and lower interest rates, since creditors see that you have a greater ability to pay. If interest rates in the overall market are low or high, this will also play a significant role on the rates you get.

Another hidden cost could be your interest rate calculation. Some creditors will make one calculation per month, others will charge per day. These differences can make a big impact on how your payments work- if there are monthly calculations, you benefit by making a big payment once per month right before the calculation. If it is daily, you benefit most by making many smaller payments throughout the month.

Building Credit From Scratch

Watch this great video from Bank of America showing how to start building credit from scratch.