In the United States (and many other countries), the question “How is money created?” comes up a lot. The treasury isn’t just printing cash all day, if they were the government debt would be zero! In the US, money is created as a form of debt. Banks create loans for people and businesses, which in turn deposit that money in their bank accounts. Banks can then use those deposits to loan money to other people – the total amount of money in circulation is one measure of the Money Supply.

If you are interested in learning how to invest your money, Read this Motley Fool Review

Money As Debt

When a person or business puts money into their bank account, it is called a “deposit”. This can be both money you are saving for the long term, or just a normal checking account used for everyday purchases. Savings accounts are generally paid interest.

When a person or business wants to take a loan from the bank to buy something, the bank uses the deposits from all of its clients in order to make that loan. Long-term savers are paid interest in exchange for letting the bank use their deposits to make these loans, but money in checking accounts can also be used (which is why some accounts charge no fees if you have a certain minimum balance).

Once the loan is taken out, the person can either take the money as cash, or (much more typically) deposit it back in to their savings or checking account. This means the money can be used to make another loan, so banks can re-lend the money again and again.

This means that virtually every dollar a bank lends out was, at some point in the chain, borrowed by someone else. The total amount of money in the economy is directly dependent on how many people and businesses have taken out loans. Even deposits made by people as income were almost certainly borrowed at some point. For example, consider this chain:

  1. May 5: Local Banks and Loans issues a loan to Frank for $10,000 to start a restaurant
  2. April 30: Bob deposits his paycheck for $5,000 at his bank (Local Banks and Loans)
  3. April 29: Alice Corporation (a software firm) gives Bob a paycheck for $5,000
  4. April 10: Carlos’s Construction pays Alice Corporation $15,000 for software it developed to plan construction projects
  5. April 1: Peggy writes a check to Carlos’s Construction to buy a new house for $200,000
  6. March 15: Peggy takes a loan out from Local Banks and Loans for $200,000

In this example, Local Banks and Loans has technically used the same $200,000 in its loans to Peggy and Frank, which was also used by a construction company to buy software, and a software company to pay its employees. The same $5,000 was used to buy a house, pay for software, hire an employee, and start a restaurant!

Reserve Requirements

To prevent banks from loaning out the same dollar infinitely, there are rules called “Reserve Requirements”. For every $100 loaned out, the bank must keep $10 on “Reserve”, meaning not re-use it on other loans. This reserve requirement can be held in the bank vaults as cash, or on deposit with the Federal Reserve Bank.

So if there is a reserve requirement, how is money created in the first place?

Relationship With The Government

When the government needs to spend money, it gets its revenue through taxes and by selling Treasury Bonds, which is effectively borrowing money from investors and banks, as well as the Federal Reserve Bank. The revenue it receives from sales of bonds to the Federal Reserve Bank is then injected in to all the other banks as the government spends money, which is what creates the initial cash “seed” that all other lending is based on – the economy buys debt from the federal government, which uses the cash to feed back in to the economy.

Currency Backing

Historically, currency has been “backed”, or readily converted in to, some material good.

Even though money is created by debt, we can say that it is “backed” by the value of all the goods and services that we use that debt to produce. Without Peggy’s loan (and other loans like it), Carlos could not buy the software, and Alice would not have been able to hire Bob to write it.

The Gold Standard

Ancient History

In ancient history, the question “how is money created” was easy to answer – they dug it up!

The primary form of currency for thousands of years was gold and silver – these metals were mined, then minted into coins. If a government wanted to “print” more money, they would melt down existing coins, then mix the gold and silver with cheaper metals (like iron and copper), then mint new coins (and hope people didn’t notice the difference).

Paper money came into existence first by banks similar to what today we would call “certificates of deposit”, or CDs. As proof that you deposited some amount of money at a bank, the bank would give you a piece of paper engraved with the bank’s information and the amount you deposited. You could then come back at a later date and request that amount in coin, or give another person authorization to withdraw some of your deposit for you (similar to a “check” today).

As more and more customers came to each bank, they standardized the certificates in set amounts, and issued people what looked like today’s money. However, since each bank was issuing their own notes, you would need to go to each bank individually to request the coins, then take them back to your own bank.
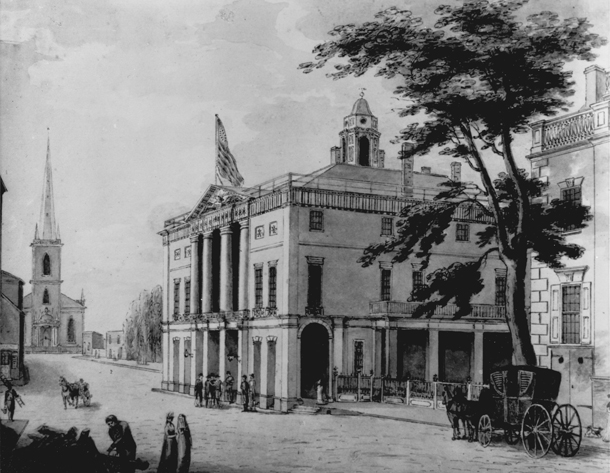
The United States

Before we started using debt as money, all money in the United States was “backed” by gold and silver – each dollar represented a specific amount of gold, and banks needed to move gold reserves between them each time someone wrote a check. This process was very expensive and time-consuming, and also meant that the total amount of money in circulation was directly proportional to how much gold was mined.

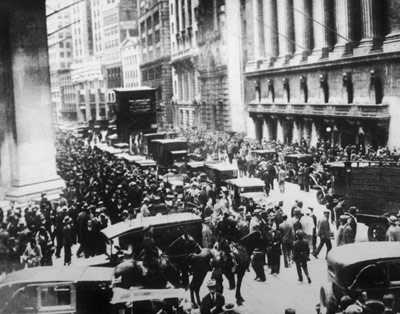
There were also reserve requirements under the Gold Standard, the reserve was simply an amount of physical gold that a bank needed to be holding at all times. This meant that when people and companies wrote each other checks, banks had to physically ship gold out to other banks every day (this was often done by rail, which is why rail robberies used to be common).

This meant that if there was an economic expansion, but gold could not be mined quickly enough, there could sometimes be not enough money to go around, causing the expansion to slow. This also meant that the government is not able to start spending money during recessions as “relief”. The Gold Standard was ended in the United States in 1976.

Definition

Cottage Industry, or the putting out system is a production system of producing goods that relies on producing goods, or parts of goods, by craftsmen at home, or small workshops, instead of large factories.

History

Cottage Industry

Cottage Industry describes the methodology that was used to produce most goods throughout human history up until the end of the Industrial Revolution. Under this system, if a company or country wanted to produce a large number of a particular item (for example, 1000 military uniforms), instead of building a large factory and hiring a large workforce, they would hire many contractors to produce a small number of items each. For example, a government would hire 100 sewers to make 10 uniforms each.

The contractors would then create the goods at home, or their cottage, and deliver them upon completion. The major advantage of this system is that it allowed farm workers to continue producing food and other agricultural goods, while filling their orders of finished goods during the time between planting and harvesting.

Another major advantage was that until very recently, most of the world’s population did not live in or near towns and cities, but rather in small farming villages. This system allowed the creation of goods across a very large area without requiring the population to travel to central factories every day.

Cottage Industry and the Industrial Revolution

After the Industrial Revolution, many goods that were formally produced using cottage industry were moved to factories, which benefited from a division of labor and a steady workforce.

However, since most products are produced in stages, each stage moved between “cottage production” and “industrial production” in stages as well. In the example of producing a shirt, first the cloth needed to be made from cotton, linen, or wool, then the cloth needed to be cut and sewn into a shirt. If the shirt had buttons, those buttons needed to be produced out of metal, then sewn onto the shirt.

In a classic cottage industry, a farm would sell the cotton, linen, or wool to many cottages, who would then spin them into yarn, using a loom to create fabric out of the yarn. Then they would cut and sew the fabric into a shirt. If they needed buttons, they could buy them from another cottage that produced buttons, then sew them onto the shirt.

When the industrial revolution started, it began with the production of textiles and fabrics. This meant a large factory would buy the cotton, linen, and wool from farmers to turn into fabric, then they would sell the textiles to cottage producers, who would complete the remaining steps.

With the new industrial processes, it allowed the creation of metal goods in factories instead of a blacksmith’s shop. This meant that one factory would produce the fabric and another would create the buttons, and both would send their goods to cottage producers to complete.

When the sewing machine was developed, the entire process was fully industrialized.

One factory would create the fabric, another would create the buttons, then both would send their products to a third factory which would cut and finish the shirts. The centralization of production allowed much more products to be produced much faster, and since the middle products (fabric and buttons in this example) did not need to be shipped in small quantities to dozens of locations, the costs of producing clothing also dropped significantly.

Cottage Industry Today

Even though most goods are now mass-produced, goods made by hand (or done using cottage production) can still be seen as a sign of higher quality. For example, expensive business suits are still generally made by hand by experienced tailors, and expensive shoes are often made by expensive cobblers or shoemakers.

In the last few years, many cottage producers have begun selling their goods on the internet (like Etsy.com, which can be traded on HowTheMarketWorks with the symbol ETSY). ETSY is entirely dedicated to cottage production and has led to a resurgence of cottage industry for custom and hand-crafted goods. However, transitioning away from cottage production to industrial production for most goods is still seen as a very important step for developing countries.

Our December stock trading contest is now finished, we had tens of thousands of trades placed to fight for the top spots! See the winners below! If you want a shot at a cash prize yourself, join our next contest!

Click Here To Join The Next Contest!
december stock trading contest

Stock Trading Contest Results

  1. smithjjj5+36.28% Return
  2. mchung37+35.23% Return
  3. max405+23.14% Return
  4. jbw10009+21.68% Return
  5. oxrossox+20.64% Return
  6. MoneyMaster15+19.86% Return
  7. l72078+19.29% Return
  8. JamesAquino+17.80% Return
  9. Malvolsky+17.34% Return
  10. afrketic+16.70% Return

The HTMW Team Finishers were:

  • studentbrooks +21.97%
  • gbrown -6.65%
  • ksmith -25.67%

See The Trading Strategies From This Contest!

JamesAquino’s Trading Strategy - Contest: December Trading Contest Final Portfolio Value: $117,803.89 (+17.80%) Trading Strategy For This Contest I’ll be general with my strategy so what I have done is I kept a max 5 stocks so it is easy to manage and chose which stock to buy wisely. (BUY WHAT YOU KNOW) that’s pretty much it 🙂 Final Read More...

About The Challenge

We held an 18-day long trading contest in December, with prizes going to the top 10 finishers, plus one random winner who placed more than 30 trades. This was the last contest of 2015.

Prizes

  • Top Portfolio Wins $100
  • 2nd and 3rd Place Win $75 Each
  • 4th, 5th, and 6th Place Win $50 Each
  • 7th, 8th, 9th, and 10th Place Win $25 Each
  • We Will Also Choose A Random Winner Out Of All Participants Who Make More Than 20 Trades For Another $50 Prize

Rules

    • There will be a full audit at the end of the investing contest on all winners to verify any corrections due to stock splits, dividends, or any other corporate action our team may have missed. Only legitimate portfolio returns will be counted in the ranking.
    • Each person is allowed only 1 entry. Users with multiple portfolios in the contest will be disqualified.
    • The usernames of the winners will be made public, but not their actual first name, last name, nor email address.
    • No member of the HowTheMarketWorks Team is eligable for any prizes

HTMW mobile
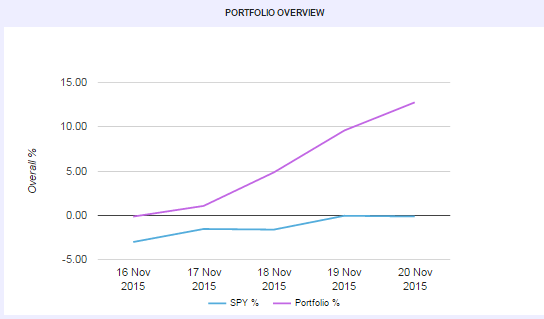
Mobile HowTheMarketWorks is now live! You can now easily trade on the go with a completely mobile-optimized interface for trading, managing your portfolio, doing research, and everything else you could want on HowTheMarketWorks!

Right now, if you log in with a tablet, we’ll still direct you to the full site, but if you’re using a smaller device we’ll take you to the mobile version. Trading and managing your portfolio should be the same experience in both places, but with smoother and cleaner layout for small screens.

Get those thumbs moving and start trading on mobile today!

As always, we’ve been making many smaller updates and enhancements every week, so happy trading!

If you’ve started buying a few stocks, you will probably be interested in diversifying your portfolio between more than one sector.

This sounds easy, but it can be very challenging finding stocks from a wide range of sources that fit what you’re looking for. Thankfully, our Quotes Tool has all the information you need to get started. Please note that this guide requires the use of the old version of our quotes page.

Finding The Sectors Tool

First, head to the Quotes page and click “Markets” at the top:

markets tab

sectors tab

Once you’re here, click “Sectors” on the lower menu:

This page will have a list of sectors you can choose from, both general categories (like “Real Estate” and “Energy”), along with sub-sectors (like “software” or “communications equipment” in the Technology sector):

internet content

You can filter between major US or Canadian sectors by default, but once you view any specific sector, you can also see stocks from other countries (like the UK).

Using The Sectors Tool To Pick Stocks

Once you click on a sector, a graph will automatically appear showing the performance of the top 3 companies in this sector (by market capitalization), but you can have up to 8 different companies charted against each other at a time.

internet content 2

The “industry peers” are listed below the chart. By default, the top 50 will appear, but you can load as many as you like. Clicking the symbol on the list will give a detailed quote for that symbol, and international companies are included.

This can be a great tool to find stocks you might not have thought of, or just a great way to quickly compare industry leaders when you’re looking to diversify your portfolio.

Definition:

“OHLC” stands for “Open, High, Low, Close”, and this is a chart designed to help illustrate the movement of a stock’s price over time (typically a trading day, hour, or minute) OHLC are very useful for provide quick visual details, especially for technical analysis.

OHLC
Example of a bar chart for Google

Details on OHLC Charts

OHLC charts are also known as “Bar Charts” because they display the information as a series of line segments instead of as a continuous line. Bar charts are very useful to see how prices are moving in a period of time – the longer the line segment, the more the price has moved during that time.

The example above is a bar chart for Google, with the bars representing 5 minute intervals. The top of each line is the “high” price reached in that period of time, while the bottom of each line is the “Low” point. The longer the lines, the more volatile the stock.

You can find these charts on our Quotes page for every US stock, and most international stocks.

Stop Wasting Money on High Interest Rate Credit Cards

All credit cards are NOT the same–find the credit card that is right for you!

If you get good grades, then choose a credit card that gives you a reward bonus for good grades.
If you can’t pay off your credit card bill each month, then make sure you have the lowest interest rate available.
If you travel a lot, then make sure you are earning frequent flyer rewards.
If you have a credit card and use it, then make sure you are getting something back and have the right card for you.

If you are a college or high school student, you might want to be taking advantage of the credit cards that are designed just for students.

If you are paying a high rate of interest on your credit card, then look at the “Low Interest” and “Balance Transfer” options. Paying high interest rates on your credit cards when you don’t have to is a waste of money. If you have $10,000 of credit card debt and you can drop your rate by 5% then you can save $41.66 a month! Stop wasting money–take 10 minutes and save!

Take a look at this chart and click on the card type that interest you:


Credit Card Payoff Calculator

If you already have a credit card and are not paying if off each month, then use this credit card payoff calculator to see how long it will take you to payoff the card.


How Credit Cards Work

Since 2010 the use of credit cards has become more popular than writing checks when paying for everyday purchases. The banks have made it easy for most people to get a credit card, and most retailers have made it very easy to use them.

how credit cards work

What is a Credit Card?

A credit card is a payment system that works like this:

  • A persons signs a bank application for a credit card and agrees to pay the credit card bill on a monthly basis.
  • The bank gives the person a credit card with a unique 16 digit number on it.
  • The person presents the credit card for payment at a store and signs a credit card slip indicating they have received the goods.
  • Every month the bank then sends the person a credit card statement showing all the charges and usually gives the person about 20 days to pay the statement in full.
  • If the person doesn’t pay the bill in full by the due date, the credit card copy then charges the person interest.

It sounds like a great system, as long as you can pay your credit card statement in full and on time. If you don’t the interest rates charged by the bank can be anywhere from 10 to 30%. That’s why it is very important to choose your credit card wisely!

Check out the latest credit card interest rates below. Click on the card type that most interests you.


Credit Card Payoff Calculator

If you don’t pay off your credit card statement in full by the due date, you can quickly dig yourself into a bad cycle of falling more and more in debt because of the interest rate and fees your may be charged. Use this Credit Card Payoff Calculator to what happens if you don’t pay the full amount due each month.


Here are some popular stories and advice for credit card users:


Contest: Second November Investing Contest

Final Rank: 2

Final Portfolio Value: $113,134.06 (+13.13%)

Trading Strategy For This Contest

I usually found stocks that had high volume and good community sentiment. As well as good stock short term news. I then bought into those stocks, and when they went up. I shorted them. MACD and Bolinger bands were also used in my trading strategies.

Final Open Positions and Portfolio Allocation

November Investing Contest HoldingsBlue Chip allocation

Performance Over The Total Contest

performance

Click Here To Join The Next Contest!


See More Trading Strategies From This Contest

sgsadamc’s November Investing Strategy - Contest: Second November Investing Contest Final Rank: 2 Final Portfolio Value: $113,134.06 (+13.13%) Trading Strategy For This Contest I usually found stocks that had high volume and good community sentiment. As well as good stock short term news. I then bought into those stocks, and when they went up. I shorted them. MACD and Bolinger Read More...
Branflakes’s November Investing Contest Strategy - Contest: Second November Investing Contest Final Rank: 5 Final Portfolio Value: $112,017.03 (+12.01%) Trading Strategy For This Contest I looked for low prices stocks breaking new highs and held on for a couple minutes or over night, then I sold them, sometimes shorting stocks that are too hyped up Performance Over The Total Contest Click Read More...
NickStalksStocks’s Investing Contest Strategy - Contest: Second November Investing Contest Final Rank: 3 Final Portfolio Value: $112,739.67 (+12.73%) Trading Strategy For This Contest First off, thanks for the great game everyone! Well played. This being my first HTMW monetized contest, I feel very humbled and excited to win. During last week, I played the VIX and biotech stocks. TVIX and Read More...

Contest: Second November Investing Contest

Final Rank: 5

Final Portfolio Value: $112,017.03 (+12.01%)

Trading Strategy For This Contest

I looked for low prices stocks breaking new highs and held on for a couple minutes or over night, then I sold them, sometimes shorting stocks that are too hyped up

Performance Over The Total Contest

performance

Click Here To Join The Next Contest!


See More Trading Strategies From This Contest

sgsadamc’s November Investing Strategy - Contest: Second November Investing Contest Final Rank: 2 Final Portfolio Value: $113,134.06 (+13.13%) Trading Strategy For This Contest I usually found stocks that had high volume and good community sentiment. As well as good stock short term news. I then bought into those stocks, and when they went up. I shorted them. MACD and Bolinger Read More...
Branflakes’s November Investing Contest Strategy - Contest: Second November Investing Contest Final Rank: 5 Final Portfolio Value: $112,017.03 (+12.01%) Trading Strategy For This Contest I looked for low prices stocks breaking new highs and held on for a couple minutes or over night, then I sold them, sometimes shorting stocks that are too hyped up Performance Over The Total Contest Click Read More...
NickStalksStocks’s Investing Contest Strategy - Contest: Second November Investing Contest Final Rank: 3 Final Portfolio Value: $112,739.67 (+12.73%) Trading Strategy For This Contest First off, thanks for the great game everyone! Well played. This being my first HTMW monetized contest, I feel very humbled and excited to win. During last week, I played the VIX and biotech stocks. TVIX and Read More...

Contest: Second November Investing Contest

Final Rank: 3

Final Portfolio Value: $112,739.67 (+12.73%)

Trading Strategy For This Contest

First off, thanks for the great game everyone! Well played. This being my first HTMW monetized contest, I feel very humbled and excited to win.

During last week, I played the VIX and biotech stocks. TVIX and UVXY are 2x leveraged etfs for the VIX (CBOE Volatility Index). After the terrorists attacks, I knew the market would be in a state of chaos so I used that to my advantage while day trading the VIX

As well I bought and sold stocks such as AVXL and KBIO. These were over bought/sold stocks along with news being released about the stocks. Honestly, most of the time with these small cap biotechs you have to go with community sentiment to win.

Thanks
Nick

Performance Over The Total Contest

performance

Click Here To Join The Next Contest!

See More Trading Strategies From This Contest

sgsadamc’s November Investing Strategy - Contest: Second November Investing Contest Final Rank: 2 Final Portfolio Value: $113,134.06 (+13.13%) Trading Strategy For This Contest I usually found stocks that had high volume and good community sentiment. As well as good stock short term news. I then bought into those stocks, and when they went up. I shorted them. MACD and Bolinger Read More...
Branflakes’s November Investing Contest Strategy - Contest: Second November Investing Contest Final Rank: 5 Final Portfolio Value: $112,017.03 (+12.01%) Trading Strategy For This Contest I looked for low prices stocks breaking new highs and held on for a couple minutes or over night, then I sold them, sometimes shorting stocks that are too hyped up Performance Over The Total Contest Click Read More...
NickStalksStocks’s Investing Contest Strategy - Contest: Second November Investing Contest Final Rank: 3 Final Portfolio Value: $112,739.67 (+12.73%) Trading Strategy For This Contest First off, thanks for the great game everyone! Well played. This being my first HTMW monetized contest, I feel very humbled and excited to win. During last week, I played the VIX and biotech stocks. TVIX and Read More...

math lesson plans

Students can never have too much math! These lesson plans are applied lessons in math, from showing how to calculate simple interest to determining “Price Per Unit” when shopping.

Math Lesson Plans For Elementary School And Up

Calculating Simple Interest

  • Source: EconEdLink, by Mike Fladlien
  • Description: This is a basic introduction to interest and its calculation for students. It covers a few different interest rate levels and time periods.
  • Using HowTheMarketWorks: We make it interactive! Have your students use our Investment Return Calculator to calculate the growth of savings over time, showing the difference between simple interest and compound interest, and even adjust according to inflation! This is also integrated into our Assignments feature, so your students can answer the quiz at the end and get credit using your Report Card.

Click Here To Access This Lesson Plan

What’s My Interest?

  • Source: EconEdLink, by Connections Cross-Curricular
  • Description: This lesson is a basic approach to calculating interest using a jellybean exercise (with an interest-bearing jellybean account), building into real-world exercises with bank rates.

Click Here To Access This Lesson Plan

A Penny Saved

  • Source: EconEdLink, by Mike Fladlien
  • Description: These lesson plans walk students through the basics of interest growth and compounding. The second half goes through more complex topics like Real interest rate, returns on investment, and nominal interest rate, but the first half of the lesson is appropriate for younger students.
  • Using HowTheMarketWorks: Our Compound Interest Calculator is great for the first half of the lesson, where students can see how their savings grows over time, while our Investment Return Calculator is great for the second half, since it can be used to control for inflation to find Real and Nominal interest rates. Since these are both integrated into our Assignments feature, it makes it easy to assign as homework, and follow all your students’ progress in their Report Card!

Click Here To Access This Lesson Plan

Math Lesson Plans For High School And Up

A The Best Deal

  • Source: EconEdLink, by Kent Steen
  • Description: Students will work through a list of groceries and attempt to see which is offering the best “Deal” by calculating and comparing the price per unit.
  • Using HowTheMarketWorks: When students are buying Exchange Traded Funds on HowTheMarketWorks, it is possible that the underlying assets of the fund are worth more or less than what the ETF is actually trading at in the markets. Have your students calculate the value of [hq]DIA[/hq], an ETF that tracks the Dow-Jones Industrial Average, using the value of the underlying stocks (they can find this information under “Filings” when looking up DIA in the Quotes tool). Is the ETF trading at a higher or lower value than its underlying assets?

Click Here To Access This Lesson Plan


Do you have a great lesson plan you would like to share, or know where we can get more to feature here? Contact our Support Team and let us know!

Our November investing contests are now finished, we had tens of thousands of trades placed to fight for the top spots! See the winners below! If you want a shot at a cash prize yourself, join our next contest!

Click Here To Join The Next Contest!


November contests

First Weekly Contest

  1. blowke +15.56%

Second Weekly Contest

  1. brendanriley +15.41%
  2. sgsadamc +13.13%
  3. NickStalksStocks +12.74%
  4. bobbyv +12.27%
  5. Branflakes1212 +12.02%

The HTMW Team Finishers were:

  • gbrown +2.48%
  • TeamHTMW +1.79%
  • ksmith -1.27%

See The Trading Strategies From This Contest!

sgsadamc’s November Investing Strategy - Contest: Second November Investing Contest Final Rank: 2 Final Portfolio Value: $113,134.06 (+13.13%) Trading Strategy For This Contest I usually found stocks that had high volume and good community sentiment. As well as good stock short term news. I then bought into those stocks, and when they went up. I shorted them. MACD and Bolinger Read More...
Branflakes’s November Investing Contest Strategy - Contest: Second November Investing Contest Final Rank: 5 Final Portfolio Value: $112,017.03 (+12.01%) Trading Strategy For This Contest I looked for low prices stocks breaking new highs and held on for a couple minutes or over night, then I sold them, sometimes shorting stocks that are too hyped up Performance Over The Total Contest Click Read More...
NickStalksStocks’s Investing Contest Strategy - Contest: Second November Investing Contest Final Rank: 3 Final Portfolio Value: $112,739.67 (+12.73%) Trading Strategy For This Contest First off, thanks for the great game everyone! Well played. This being my first HTMW monetized contest, I feel very humbled and excited to win. During last week, I played the VIX and biotech stocks. TVIX and Read More...

About The Challenge

We held 2 week-long contests in November: one a winner-takes-all, and the other giving prizes to the top 10 portfolios. As with all of our contests, everyone starts with $100,000, and can invest in any collection of US stocks or ETFs. There is a 25% position limit, so you can’t put more than a quarter of your portfolio in any one symbol.

Rules

    • There will be a full audit at the end of the investing contest on all winners to verify any corrections due to stock splits, dividends, or any other corporate action our team may have missed. Only legitimate portfolio returns will be counted in the ranking.
    • Each person is allowed only 1 entry. Users with multiple portfolios in the contest will be disqualified.
    • The usernames of the winners will be made public, but not their actual first name, last name, nor email address.
    • No member of the HowTheMarketWorks Team is eligable for any prizes

Simply put, when you have money to invest for an extended period of time (like 20 years or more), the stock market historically has provided the greatest return.

When most people are able to save money, they usually put it in the bank. Banks usually pay interest on the cash in your account, so if you have 1,000 in your savings account, and the bank pays you 3% interest then at the end of a year you will have about 1,030. Once the savings balance gets bigger, a lot of people hope to earn more than what the bank is paying in interest, so they invest in real estate, stocks, bonds, and/or gold.

Historical Returns of Investments

While no one knows for sure what will happen in the future, a look at historical returns shows how these different investments have performed over time.

Here’s a chart of average percentage returns for the 30 year period from 1988 to 2018:

Data Source: Portfolio Visualizer.com

From this chart we see that the stock market has performed the best – between a 9-fold and 11-fold increase, depending on the security types. Gold performed the worst – one major reason being that gold tends to go up in price during years where there is low inflation, and down in years with high inflation.

So what does that mean? Over time there is a HUGE difference between 10% and 2%. Here is another way to look at it–this chart shows the growth of $100 for the 46 years from 1972 to 2018.

So, would you rather have 401 or 1,612! That’s a big difference for just 100. For 10,000 the results would be exactly 100x or 40,100 versus 161,200.

Finally, this chart looks at average returns from 198 through 2018 and shows that the S&P 500 stocks were the best return, with a 12% average annual return – beating out both the large-cap stocks in the Dow Jones Industrial Average and the Small-Cap stocks in the Russell 2000 index.

In this table you also need to note the Standard Deviation column which measures the variance or volatility of the returns. It shows that Small Stocks also have the highest variance. This is why we say “over time” that stocks have the highest returns. If you looked at just one year or even five years, you might not see the same results because stocks are so volatile, but the longer the time period you have to keep the money invested the better it is to invest in stocks.

Summary

Simply put, if you want to maximize your personal net worth, if you want to be rich, if you want to be a millionaire, if you want to retire early–you must start saving and investing TODAY.

The earlier you get started, the more time your money has to grow.  And the more time it has to grow, the bigger it will become.

Understanding how the stock market works and how to invest is so important because it determines how much your net worth will be when you retire.  Are you going to leave your cash in your savings account at the bank all your life and earn an average of 3%?  Or are you going to invest it in the stock market and try to earn 11%?

How To Invest in the Stock Market

The best way to learn anything is to practice.  Use this virtual trading site to learn to invest and experiment with trading strategies.  Don’t worry if you make mistakes–better to lose our fake money then your real money later.

You can use www.StockBrokers.com to compare special offers, commission rates, and other services of more online brokerages to find the perfect one for you. (Don’t worry, you can click www.StockBrokers.com and it will open a new tab so you won’t lose your place in this course.)

Pop Quiz!

[mlw_quizmaster quiz=22]

Contest: October Third Daily Challenge

Final Rank: 7

Final Portfolio Value: $101,621.37 (+1.62%)

Trading Strategy For This Contest

For the October 3rd Daily Contest I picked a mix between triple-leveraged ETFs and a few companies that I felt were undervalued. The triple-leveraged ETFs are great for a daily competition because the profits are huge if you are on the right side of the market. My big winner ended up being FAS, a triple-leverage financial bull. I also made a good profit on AMZN and GOOGL because I felt they were undervalued and I got lucky because they had a lot of positive movement that day.

Blue Chip Stock HoldingsBlue Chip allocation
Click Here To Join The Next Contest!
AWESOM-0’s Third October Daily Contest Trading Strategy - Contest: October Third Daily Challenge Final Rank: 7 Final Portfolio Value: $101,621.37 (+1.62%) Trading Strategy For This Contest For the October 3rd Daily Contest I picked a mix between triple-leveraged ETFs and a few companies that I felt were undervalued. The triple-leveraged ETFs are great for a daily competition because the profits are huge if Read More...
RUINTHERE’s Third October Daily Contest Trading Strategy - Contest: October Third Daily Challenge Final Rank: 1 Final Portfolio Value: $108,724.97 (+8.72%) Trading Strategy For This Contest The strategy I prefer to use is to look for stocks that have been unfairly beaten down. Many stocks are down at any given time and most justifiably so. However, there are those that have become oversold. Read More...
RiskOn’s October Day Trading Strategy - Contest: October First Daily Challenge Final Rank: 1 Final Portfolio Value: $104,671.33 (+4.67%) Day Trading Strategy For This Contest For this daily contest, I purchased 4 ETF stocks, then sold 2 of them once I had a good lead, not wanting to give up all of my gains. My strategy is to purchase the riskiest Read More...
ksmith’s October Day Trading Strategy - Contest: October First Daily Challenge Final Rank: 3 Final Portfolio Value: $102,112.25 (+2.11%) Day Trading Strategy For This Contest For this day-trading contest, my big winners were the triple-leveraged ETFs (Click Here for a list of leveraged ETFs!) [hq]DWTI[/hq] and [hq]JDST[/hq]. [hq]DWTI[/hq] is a triple-leveraged Bear Oil ETF, so when oil goes down by 1%, Read More...
hoabidebay’s First October Week Contest Trading Strategy - Contest: October First Weekly Challenge Final Rank: 1 Final Portfolio Value: $116,943.82 (+16.94%) Trading Strategy For This Contest I select highly volatile and liquid stocks / ETFs to trade, paying attention to how they behave (gap up/down) the 1st 15 min of the opening session. Final Open Positions and Portfolio Allocation Performance Over The Total Read More...
BranFlakes1212’s October Day Trading Strategy - Contest: October First Daily Contest Final Rank: 6 Final Portfolio Value: $101,341.05 (+1.34%) Day Trading Strategy For This Contest I usually focus on Lower priced stocks because they tend to be more volatile. Tuesday however didn’t have very many stocks doing what I prefer to trade, so I pretty much picked one of the top Read More...

Contest: October Third Daily Challenge

Final Rank: 1

Final Portfolio Value: $108,724.97 (+8.72%)

Trading Strategy For This Contest

The strategy I prefer to use is to look for stocks that have been unfairly beaten down. Many stocks are down at any given time and most justifiably so. However, there are those that have become oversold. When the weak hands have already sold the bargain hunters move in. These points can be identified through technical analysis tools such as MACD, TRIX, and others. But technical analysis on its own isn’t enough. It is necessary to follow company specific, industry, and general news to understand the context of what the charts are saying. If you not careful you could get caught in the next wave of selling.

Blue Chip Stock HoldingsBlue Chip allocation
Click Here To Join The Next Contest!

See More Trading Strategies From This Contest

AWESOM-0’s Third October Daily Contest Trading Strategy - Contest: October Third Daily Challenge Final Rank: 7 Final Portfolio Value: $101,621.37 (+1.62%) Trading Strategy For This Contest For the October 3rd Daily Contest I picked a mix between triple-leveraged ETFs and a few companies that I felt were undervalued. The triple-leveraged ETFs are great for a daily competition because the profits are huge if Read More...
RUINTHERE’s Third October Daily Contest Trading Strategy - Contest: October Third Daily Challenge Final Rank: 1 Final Portfolio Value: $108,724.97 (+8.72%) Trading Strategy For This Contest The strategy I prefer to use is to look for stocks that have been unfairly beaten down. Many stocks are down at any given time and most justifiably so. However, there are those that have become oversold. Read More...
RiskOn’s October Day Trading Strategy - Contest: October First Daily Challenge Final Rank: 1 Final Portfolio Value: $104,671.33 (+4.67%) Day Trading Strategy For This Contest For this daily contest, I purchased 4 ETF stocks, then sold 2 of them once I had a good lead, not wanting to give up all of my gains. My strategy is to purchase the riskiest Read More...
ksmith’s October Day Trading Strategy - Contest: October First Daily Challenge Final Rank: 3 Final Portfolio Value: $102,112.25 (+2.11%) Day Trading Strategy For This Contest For this day-trading contest, my big winners were the triple-leveraged ETFs (Click Here for a list of leveraged ETFs!) [hq]DWTI[/hq] and [hq]JDST[/hq]. [hq]DWTI[/hq] is a triple-leveraged Bear Oil ETF, so when oil goes down by 1%, Read More...
hoabidebay’s First October Week Contest Trading Strategy - Contest: October First Weekly Challenge Final Rank: 1 Final Portfolio Value: $116,943.82 (+16.94%) Trading Strategy For This Contest I select highly volatile and liquid stocks / ETFs to trade, paying attention to how they behave (gap up/down) the 1st 15 min of the opening session. Final Open Positions and Portfolio Allocation Performance Over The Total Read More...
BranFlakes1212’s October Day Trading Strategy - Contest: October First Daily Contest Final Rank: 6 Final Portfolio Value: $101,341.05 (+1.34%) Day Trading Strategy For This Contest I usually focus on Lower priced stocks because they tend to be more volatile. Tuesday however didn’t have very many stocks doing what I prefer to trade, so I pretty much picked one of the top Read More...

Contest: September Monthly Million Contest

Final Rank: 1

Final Portfolio Value: $1,308,146.64 (+30.8%)

Trading Strategy For This Contest

My strategy is finding pharmaceutical/biotech companies. I find corporations that are testing products. I look for ones who have an upcoming announcement on phase 3 testing or FDA approvals. I keep those stocks on my watchlist. Once I see that a stock’s product gets an FDA approval, I would buy it. I usually hold it for no longer than 2 days. These stocks are usually overbought by that point and you’ll anticipate sell-offs. Once I see a weakness in the trend, I would sell it. This weakness in the trend can be seen when the stock breaks down multiple levels of resistance. More than 2 breakdowns and I’m out. Depending on how high it rose, one breakdown may be enough.

Click Here To Join The Next Contest!

See More Trading Strategies From This Contest

AngelRivera’s September Trading Strategy - Contest: September Monthly Million Contest Final Rank: 1 Final Portfolio Value: $1,308,146.64 (+30.8%) Trading Strategy For This Contest My strategy is finding pharmaceutical/biotech companies. I find corporations that are testing products. I look for ones who have an upcoming announcement on phase 3 testing or FDA approvals. I keep those stocks on my watchlist. Once Read More...
smithjjj5’s September Trading Strategy - Contest: Official September Contest Final Rank: 5 Final Portfolio Value: $1,119,202.95 (+11.19%) Trading Strategy For This Contest My strategy is to look for stocks to short that are moving up (30% +)on news with greater than average volume. So much of the time people get overly excited about the news and drive the price higher Read More...
wkaraman14’s September Trading Strategy - Final Rank: 3 Final Portfolio Value: $1,181,543.46 (+18.15%) Trading Strategy For This Contest I used was mainly “gap plays”; I analyze gaps in the premarket everyday, once I determine if the gap will be filled for short term investing, I will place my trade and swing looking for a 10%-20% profit. 90% of all gaps Read More...

Definition

“Wall Street” is a street in New York City, near the southern end of Manhattan Island. It is the home of the New York Stock Exchange, and the biggest center of stock trading and finance in the world.

History

Old map of Wall Street

Before New York was New York, it was a Dutch colony called New Amsterdam, which only took up a small area in the south of Manhattan Island. As part of the town’s defenses, in the 17th century a wall was built near the town center.

The street build along the wall was called Wall Street, and remained so even long after the walls were torn down and the city continued to grow.

Over time, businessmen began to meet near the old Wall, at a buttonwood tree near the intersection of Wall Street and Broad Street. By 1792, most of the young city’s investors would meet here to trade Revolutionary War bonds, bonds issued by various state and local governments, and a small amount of stocks from the growing businesses in the area.

Wall Street and the United States

Wall Street 1790

Wall Street also had an important government function: in 1700, a new City Hall for New York City was built on Wall Street. As the American Revolution drew near, this building was also where the Freedom of the Press was established (with a lawsuit of the British government against a newspaper printer for libel, he was found not guilty because what he published was true), and where delegates from 9 of the colonies met to draft a letter to King George and the British Parliament in response to the Stamp Act, making the famous claim of “No Taxation without Representation”.

After the Revolutionary War, the city hall became Federal Hall, and served as the capitol of the United States from 1785 until 1789 (where, among other things, the Bill Of Rights was signed). After this, it became a customs house, and later part of the Treasury system. It is now a national monument.

Growing Business

In 1817, the businessmen who had continued to meet near the buttonwood tree to trade Revolutionary and United States bonds (along with small amounts of stocks) pooled their resources to rent an empty building across the street from their old meeting place so they could continue to meet even when it was cold and raining. This building became the first home of the New York Stock Exchange.

Keep Your Students Engaged With A Year Long Stock Game!

HowTheMarketWorks' Free Stock ContestsIf you’ve already used HowTheMarketWorks with your class, you know it can be one of the most fun and engaging part of the year for your students. However, just because your students have finished their unit on personal finance or investment doesn’t mean they can’t keep practicing!

We have been running investment challenges with schools for over 20 years, so here are some tips and tricks to running year long challenges for your class, your grade, or even your whole school! Setting up a year-long challenge is a great way to increase student engagement and make sure your lessons really stick!

Start Early!

multiple stock contestsIt is never too early to set up your stock game! Even if your class challenge is still running, getting your Year Long Challenge started can be a great way to re-engage some of the students who might have fallen behind the class rankings early. Your students can continue to use the same username and password they used for your first class contest, and can easily switch between any other contests they have joined on most pages across the site.

When you register your new contest, you’ll get a link to send your students (just like the first time), if they click this link when logged in, they will join your new contest automatically. They can also find it by searching on the “Join Contests” page.

Click Here to set up your year long stock game!

Invite Lots Of Students!

If you are holding a year-long stock game, try to get other classes involved! The optional contests are a fun way to foster some healthy competition between classrooms, and work well in keeping your own students engaged in the long term. The more students you have join, the more likely the ones who didn’t at first will start to join their friends!

Use Assignments To Encourage Participation!

student assignment progressAssignments are more than just keeping track of your students, they can be a great way to help students who did not participate in your first class challenge to get to know how to use the site and do research (by requiring new students to watch our videos), and you can continue to boost participating by setting assignments to make 5 or 10 trades per week, offering bonus points to students who take part.

You can create unlimited assignments for each contest, so feel free to add a new “Place 5 trades” or “Make 3 limit orders” every week, and just remove the old assignments after the week is over!

Give Incentives!

HTMW certificatePrizes and incentives are always a great way to encourage participation! We have two great ways you can encourage students on-site: you can give away one of our T-Shirts, or even just offer certificates to the winners to help!

You can find our certificate template here, or browse our shop for great stuff to give away on our Shop page!


No Time For A Year-Long Challenge? Mention Our Prized Contests!

We have at least one (and up to 6!) stock games with prizes every month, we gave away over $1,000 to students across the country who finished in the top 5 from our last contest! Our prized contests are usually fairly short – one month to one week – but because there is a new one every month, it can keep students engaged by never being too far behind everyone else!

You can see the details on the next upcoming contest here!

Definition

The New York Stock Exchange (or NYSE) is the largest stock exchange in the world. Think of it as an organized, fast-paced flea market where buyers and sellers from all over the world come to trade U.S. stocks (and now some foreign shares as well). It is where over 2,800 of the biggest U.S. companies have their shares listed. On average, over 1 billion shares are traded each day. It is located on Wall Street in New York City.

New York stock exchange facade with USA flags

History

Before the New York Stock Exchange became as powerful as it is today, it started as a group of merchants meeting near a buttonwood tree in the late 1700s to trade bonds (from cities, states, and even revolutionary war bonds), and a few stocks from the growing businesses in New York City. These merchants met near the intersection of Wall Street and Broad Street until they pooled their resources in 1817 to rent a building on Wall Street so they could continue to meet and get out of the cold and rain. This building became the first New York Stock Exchange (NYSE).

During the 1800s, the industrial revolution began sweeping across the country and the NYSE was at the center of financing its growth. Thousands of businesses were started and needed access to cash to finance their growth. Many of them sold stock on the NYSE to raise capital to build factories and expand. The first half of the 19th century also saw a huge boom in canal building; canal construction was financed usually partly through government funding (which was raised by selling bonds) and by selling stock in the canal companies to investors (which was sold in stock that paid dividends based on the canal tolls once completed). By the 1840s, canal companies were replaced with railroad construction, which was almost entirely funded by the sale of stock.

It was during the railroad boom that the NYSE transitioned from being centered around bond trading to being mostly focused on the buying and selling of stock. However, it was not just because of the railroads that this transition took place: the invention of the telegraph allowed the news of stock prices to reach investors immediately, rather that waiting for newspapers and other publishers to compile lists at the end of the day or week (which often would not include anywhere near all of the stocks currently on the market). This also allowed buyers and sellers across large distances to trade relatively easily, since it could be done through brokers in respective cities who specialized in trading.

The industrialized companies with their huge growth (and so potentially very valuable stocks) were the biggest reason investors on Wall Street began to move into stock trading rather than bonds. With a bond, the yield is usually based on the likelihood that whoever is borrowing the money will “default”, and fail to pay it back. Stock prices are based on the expected future profits of the business they represent ownership of. Before the industrial revolution, most businesses outside of very large trading organizations grew very slowly and usually did not issue any public stock at all. For most investors, buying bonds was either risky (because of a risk of default) or had fairly low yields, and was the only option available. Industrial companies often promised big growth and big profits, and were eager to sell shares to the public to raise capital quickly (so they could start business faster), encouraging new investors to take part. The huge boom of growth in canal and rail stocks carried over to other industries, and has grown ever since.

The NYSE was the center of some of the most important economic events in the United States, including the extremely well-known “Black Thursday” in 1929, which is one of the events that started the Great Depression.

The NYSE Today

The NYSE is still the largest stock exchange in the world, and will likely continue to be for a very long time. Traders from around the world still meet to trade on the NYSE floor, but as more and more trading by large financial firms is done completely electronically, and more individuals are trading stocks using their online brokerage accounts, the NYSE and Wall Street act as a global symbol for investment and the financial world.