What is a Stock?

When starting a business, the business structure usually falls into one of three categories: a sole proprietorship, a partnership, or a corporation. In this intro to stocks, you’ll learn the basics of the different kinds of business structures, and how stocks are issued to help raise capital for business expansion.

A proprietorship is the simplest and has just one owner, a partnership generally has 2 or more partners that reach an agreement as to their responsibilities and ownership percentage. Businesses that incorporate create a separate legal entity (a corporation) and then issue share certificates (stocks) to show who owns how many shares of the corporation.

Corporations usually start off small with just a few shareholders. For example, a corporation when it is formed could issue 100,000 shares of stock. The person with the business idea may put in $50,000 of his own money, and then ask his first 5 employees to each put in $10,000. This business would then have 6 shareholders: the founder would have 50,000 shares, and each of the 5 employees would own 10,000 shares.

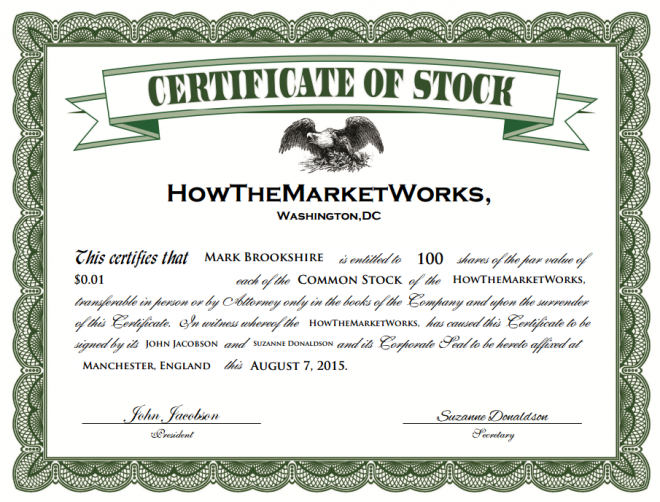
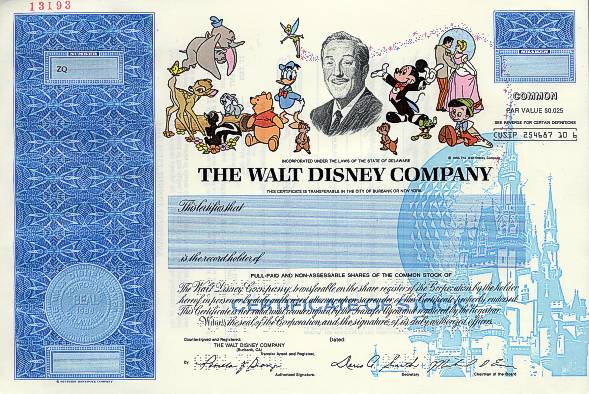
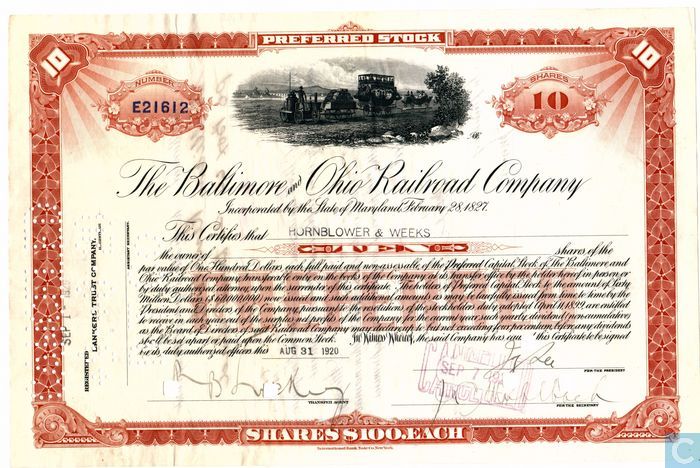
As corporations grow, they often find they need to raise more money and get a lot more investors. They often turn to Wall Street to help them raise more money by selling more shares of the company. If you bought 100 shares of a company you might get a stock certificate like the one above indicating your ownership.

If you decided you no longer wanted to own those shares you could try to sell them to another investor that might want to own part of that company. This is the essence of the stock market–it is where investors invest in new companies, or they buy and sell (or exchange) shares if they can agree on a fair price.

New York stock exchange facade with USA flags

Pro tip: There are many stock picking services which will help you find the BEST stocks to invest in. Check out this review of the Motley Fool’s Service.

Definition

Disney Stock Certificate

A stock is defined as a share of ownership of a company; if you own a company’s stock, you actually own a percentage of the company itself (including its assets, like chairs, vehicles, and buildings) and a percentage of its profits.

People invest in companies that they think will be profitable with the hope that the company will start paying out its profits to its shareholders. Likewise, if the company was not profitable and decided to close, then the company might just sell all of its furniture for $1,000 and you would only get $100 back.

For example, if a company issued 1,000 shares and you owned 100 shares, that does not mean that you can go to the company headquarters and take 1/10 of the furniture. It means that if the company was profitable and they made $100,000 and decided to pay it out to the shareholders, you would get 1/10 of $100,000 which is $10,000.

Role of Stock Exchanges

Stock exchanges provide a platform for buyers and sellers to trade shares of publicly listed companies. These exchanges, such as the New York Stock Exchange (NYSE) and the NASDAQ, act as an intermediary between investors and companies. Whether stock trading is happening on a physical trading floor, or through electronic trading systems, the exchanges allow for an efficient settlement process. This means investors can buy and sell shares of companies from around the world. Providing investors access to a wide range of investment opportunities, and allowing companies to raise capital to manage their business operations or for further growth.

In the US, stock exchanges are primarily regulated by government agencies like the Securities and Exchange Commission, (SEC) to ensure they operate fairly and to protect investors from fraud, as well as preventing a stock market crash. To maintain a fair and efficient platform, stock exchanges may suspend all trading or impose a trading restriction on a certain company or ticker symbol if they no longer meet the listing requirements of a publicly traded company. The SEC provides a list of suspended stocks on their website, sec.gov.

Below are some key regulations that help to maintain fair trading on all stock exchanges in the United States.

  • The Securities Exchange Act of 1934: provides a framework for securities exchanges by authorizing the SEC to regulate and oversee brokerage firms and exchanges.
  • The Investment Company Act of 1940: this act aims to protect investors through requiring investment companies to provide accurate and timely information about their holdings.
  • The Dodd-Frank Wall Street Reform and Consumer Protection Act of 2010: this act enhanced consumer protection through increased regulation of financial institutions, including the creation of a new agency called the Consumer Financial Protection Bureau (CFPB) that regulates financial products like credit cards and student loans.

What Does Owning Stock Get Me?

Since you own part of the company, you are now involved in some of its management decisions, and you are entitled to some of the company’s profits. Shareholders often get to vote to choose the Board of Directors, to pick independent accountants, to approve any major change in the company like merging with another company. What exactly you are entitled to depends on the amount of stock that you own. Take the company Apple, for example.

Apple has approximately 5.575 billion shares outstanding, so if you owned 100 shares of Apple, you would own 0.00000179% of the company. That seems like a tiny amount, but keep in mind that Apple makes $50 billion a year so if they paid out all of their earnings one year, you would get $896!

If you decide that you no longer want to own your Apple shares, you can always sell your shares on one of the stock exchanges.

Types Of Stock

There is more than one kind of stock or ownership that companies sell. While almost all stock traded on the stock exchanges is common stock, some companies have issued preferred stock.

Common Stock

Common stock is the kind most investors buy. Common stock generally gives one vote at shareholder meetings for every share owned. Common stock holders may also be entitled to receive distributions of the companies profits, called dividend payments.

For blue chip stocks, or larger and more stable companies, a portion of corporate profits is usually paid back to shareholders 4 times a year as a dividend. Companies that are still growing usually pay no or very little dividends; but well established companies like utilities generally pay higher dividends.

Preferred Stock

Generally, preferred stocks do not have voting rights, and you won’t find them trading on an exchange. However, preferred stock shares have the benefit of preference for dividend payments; if a company decides it is going to pay dividends, preferred stock holders may get a bigger share, and be paid before common stock holders. Preferred stock holders are also entitled to be paid first if a company goes bankrupt and all the assets are sold off.

Preferred Stock Certificate

The Difference Between Stocks and Bonds

When you buy a stock, you are buying a piece of ownership of a company. A bond, however, is more like a loan or debt; a bond is a promise that a company makes to pay back the amount you lent them plus interest. Hence, if you own a bond, you are only lending a company money, but if you own a stock, you own part of the company itself.

Where Do Stocks Come From?

New shares in a company can come from two places: New Issues and Stock Dividends (or Splits)

IPO Growth

New Issues (Initial Public Offering)

A new issue of stock is when a private company decides to go public, and issues shares of stock for anyone to buy. This is often called an Initial Public Offering, or IPO, and when large private companies go public, it can be a very exciting event with huge fluctuations in the stock’s price in the first weeks while the market decides on a fair price for the shares.

Private companies go public and issue stock primarily to raise money. As they sell the shares in the company, the original owners allow the public to vote on some management decisions in exchange for the cash raised in the stock sale to re-invest and help the company grow.

Stock Dividends (Splits)

Companies may also issue new shares of stock after the IPO. This can be done by giving all current shareholders additional shares in proportion to how many shares they currently have; for example they can say that for every 10 shares you own now, they are issuing you one extra share.

This would be a 10% stock dividend, and the market price for the stocks would drop by 10% (although all shareholders still have the same ‘value’).

If the stock dividend is large enough (usually about 20%), it is instead called a stock split. There are many reasons why companies would want to have a stock dividend or split, but they usually happen for one of two reasons:

Attract Attention and Increase Trading

Companies may split their stock to attract attention to the company through the hype that can come from a stock dividend. However, the simple act of there being more shares in circulation may encourage people to buy and sell more, since each individual share takes up a smaller percentage of a portfolio.

Lower The Price

Some large companies like to have their stock price stay in a certain range. One reason for this is that the more expensive a stock, the fewer people who can afford to buy it (or buy an additional share). So splitting stocks can help it become more affordable, and increase the total value of all stocks in the long run.

History Of Stocks

Stocks trace their origins back to the Roman Empire, where large, private companies that carried out some public duties would sell shares of stock to Roman citizens for the same reasons companies do today; raise cash and grow their business.

Over the centuries, Joint Stock Corporations were often chartered by monarchs for large projects that the government simply did not want to invest all the cash (and therefore risk) to fund.

For example many canal projects, railroads, and roads in Western Europe were built by Joint Stock Corporations; private investors who were willing to take the risk that a project would fail in exchange for some of the profits if it succeeded.

During the Age of Exploration, joint stock corporations were what funded explorers to voyage across oceans, and later ship goods across continents. The British East India Company is perhaps the most famous of these, which was involved in everything from the exploration of Canada and the Americas to the British conquest of India, and even the slave trade.

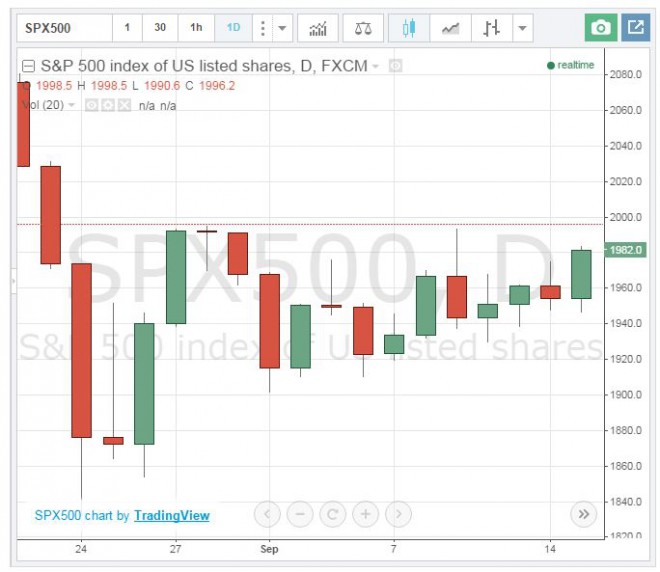
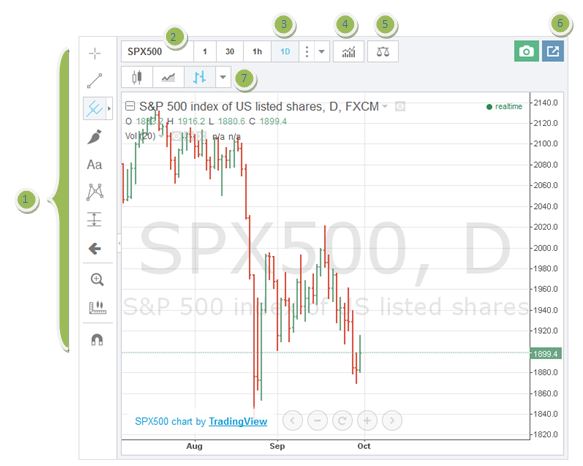
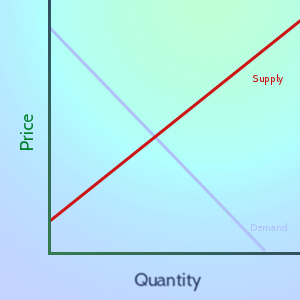
How are Stock Prices Determined?

Stock prices are determined by the forces of supply and demand in the financial markets.

When there are more buyers than sellers, demand is greater than supply, and prices tend to rise. On the other hand, when there are more sellers than buyers, supply is greater than demand, and prices tend to fall. This is known as the law of supply and demand, and is the driving force behind the fluctuations in stock prices.

Stock Prices impacted by supply and demand

If a company announces in their latest earnings report that there will be major revenue growth, investors may become more optimistic, which often leads to an increase in demand for its shares and a subsequent rise in price. Earnings reports have a significant impact on stock prices. Understanding the impact of earnings report on stock prices will help you time your investments.

Earnings Reports

An earnings report, (a.k.a. quarterly earnings report or quarterly results), is a financial report released by a publicly traded company that summarizes its financial performance for a specific quarter or fiscal year.

The report typically includes information on the company’s financial performance during the reporting period.

  • Revenue: total amount of money earned by the company.
  • Net income: profit or loss for the period, calculated by subtracting expenses from revenue.
  • Earnings per share (EPS): net income divided by the number of outstanding shares, providing a measure of profitability per share.
  • Gross margin: the cost of goods sold subtracted from revenue, expressed as a percentage.
  • Operating expenses: includes all expenses, like salaries, rent, and marketing costs.
  • Operating income: profit from operations, calculated by subtracting operating expenses from revenue.
  • Cash flow: inflows and outflows of cash during the period.

The report is typically released after the market closes on the scheduled date. If the report shows strong earnings, the stock price may rise as investors become more confident in the company’s future. However, if the report shows weak earnings, the stock price may fall as investors become more cautious about where the company is going. In the short-term, earnings reports are a key driver of price fluctuations. In the longer term, other factors such as economic indicators, interest rates or major global events, (like 9-11) will impact stock prices.

“Beating the Market”

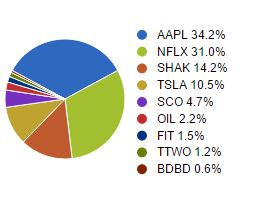
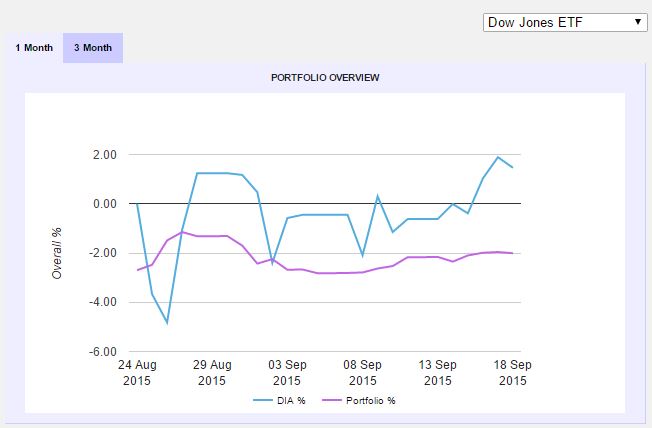
“Beating the Market” is a concept in investing that aims to achieve higher returns than the overall performance of the stock market or a specific benchmark. The most used benchmarks are the S&P 500 and the Dow Jones Industrial Average. For example, if the S&P 500 has a 10% return, and you’re able to reach 12% on your investments over the same time period, then you’ve successfully beaten the market. There are many index funds, or Exchange Traded Funds (ETFs) that track these benchmarks which you can invest in, instead of buying the individual stocks for each company.

Investors want to beat the market because they want to protect their buying power. The stock market is affected by inflation, economic downturns, and changes in interest rates, (among other factors). When inflation is high, the value of money goes down, so investors need to earn higher returns to maintain their purchasing power. Stocks can provide a hedge against inflation by offering a potential for long-term growth that can keep pace with rising prices.

It’s challenging for any investor to consistently beat the market, but if you focus on building a well-diversified portfolio, you should be able to limit the risks of of unpredictable prices on the stock market.

Risks of Investing in Stocks

There are risks associating with investing your money in any type of asset. Although stocks have proven to be one of the best ways of growing your wealth over the long-term, it’s important to understand and manage the risks of investing in the stock market. Below are some of the main risks to look out for as you get started with investing in stocks.

  • Market Volatility: in the short-term stock markets will change rapidly due to investor sentiment, or how investors are feeling about the direction of a company or industry; as well as trading volumes, or how many investors are actively trading a particular stock. Bull markets (rising prices) mean there is a lot of investor confidence, whereas bear markets (falling prices) mean there is a lot of uncertainty.
  • Economic Changes: announcements about positive or negative changes in GDP growth, unemployment rates, interest rates or inflation rates will impact how the stock market performs as a whole.
  • Company Performance: earnings reports (explained above), changes in management, mergers or acquisitions, as well as announcements of dividends or stock splits will impact the price of specific stocks or companies.
  • Global Events: wars, natural disasters, pandemics, political unrest or other major news can change the direction of prices in certain industries or the markets as a whole.
  • Regulatory Changes: tax law changes, for instance increases in capital gains tax, or new regulation for financial institutions can change investors’ behavior which leads to changes in all financial markets.
  • Technological Advancements: technological disruptions happen in every industry, some innovations like artificial intelligence affect all industries, while others like the introduction of digital image processing affected some companies and industries more than others. It’s increasingly important for investors to stay up-to-date on how new innovations will impact the companies in their stock portfolios.
  • Currency Fluctuations: changes in the value of currencies will impact the prices of international and domestic stocks. For example, if the strength of the US dollar increases, this could have a negative impact on companies that rely on exports as their goods will be more expensive (and less desirable) than goods from countries will weaker currencies.
Risks of investing in stocks

Mitigating Risks

As a beginner investor, it’s natural to feel nervous about the risks associated with investing in the stock market. However, there are several methods you can use to mitigate these risks and increase your chances of success. One of the most effective ways to do this is by diversifying your portfolio. Check out this article, How to Diversify Your Portfolio to learn more.

Another method is to use stop-loss orders, which is a set of instructions you provide your broker, (online broker or brokerage account) to automatically sell off your shares if the price decreases below a certain threshold. You can learn more about different Order Types and practice setting them up in your HowTheMarketWords account.

Finally, you can limit your risks by keeping a long-term perspective while building and managing your stock portfolio. Though it is tempting to make quick gains through actively buying and selling stocks, you can end up losing money through getting the timing wrong, as well as losing money through taxes and fees.

By understanding the basics of stocks and how the stock market works, you can start investing in stocks to reach your investment goals.

Contest: October First Daily Challenge

Final Rank: 1

Final Portfolio Value: $104,671.33 (+4.67%)

Day Trading Strategy For This Contest

For this daily contest, I purchased 4 ETF stocks, then sold 2 of them once I had a good lead, not wanting to give up all of my gains.

My strategy is to purchase the riskiest 2X and 3X ETF stocks available, use all available cash, and most often enter the market in counter trend at the point where the latest short term market trend appears to be ending. In this way I ride the new trend from the beginning for maximum gain. Once this new counter trend appears to be ending, I will take my profits. There are several tools and algorithms that can be used to predict the beginning or end of a trend. For this contest I used the CCI which is good at predicting an overbought or oversold situation. Warning: This strategy is an extremely risky one, that I would never try in real life with my own money.

Other good strategies for stock picking contests, are to play earnings surprises, or play the big movers of the day.

Final Open Positions and Portfolio Allocation

October Stock HoldingsOctober allocation
Click Here To Join The Next Contest!

See More Trading Strategies From This Contest

AWESOM-0’s Third October Daily Contest Trading Strategy - Contest: October Third Daily Challenge Final Rank: 7 Final Portfolio Value: $101,621.37 (+1.62%) Trading Strategy For This Contest For the October 3rd Daily Contest I picked a mix between triple-leveraged ETFs and a few companies that I felt were undervalued. The triple-leveraged ETFs are great for a daily competition because the profits are huge if Read More...
RUINTHERE’s Third October Daily Contest Trading Strategy - Contest: October Third Daily Challenge Final Rank: 1 Final Portfolio Value: $108,724.97 (+8.72%) Trading Strategy For This Contest The strategy I prefer to use is to look for stocks that have been unfairly beaten down. Many stocks are down at any given time and most justifiably so. However, there are those that have become oversold. Read More...
RiskOn’s October Day Trading Strategy - Contest: October First Daily Challenge Final Rank: 1 Final Portfolio Value: $104,671.33 (+4.67%) Day Trading Strategy For This Contest For this daily contest, I purchased 4 ETF stocks, then sold 2 of them once I had a good lead, not wanting to give up all of my gains. My strategy is to purchase the riskiest Read More...
ksmith’s October Day Trading Strategy - Contest: October First Daily Challenge Final Rank: 3 Final Portfolio Value: $102,112.25 (+2.11%) Day Trading Strategy For This Contest For this day-trading contest, my big winners were the triple-leveraged ETFs (Click Here for a list of leveraged ETFs!) [hq]DWTI[/hq] and [hq]JDST[/hq]. [hq]DWTI[/hq] is a triple-leveraged Bear Oil ETF, so when oil goes down by 1%, Read More...
hoabidebay’s First October Week Contest Trading Strategy - Contest: October First Weekly Challenge Final Rank: 1 Final Portfolio Value: $116,943.82 (+16.94%) Trading Strategy For This Contest I select highly volatile and liquid stocks / ETFs to trade, paying attention to how they behave (gap up/down) the 1st 15 min of the opening session. Final Open Positions and Portfolio Allocation Performance Over The Total Read More...
BranFlakes1212’s October Day Trading Strategy - Contest: October First Daily Contest Final Rank: 6 Final Portfolio Value: $101,341.05 (+1.34%) Day Trading Strategy For This Contest I usually focus on Lower priced stocks because they tend to be more volatile. Tuesday however didn’t have very many stocks doing what I prefer to trade, so I pretty much picked one of the top Read More...

Contest: October First Daily Challenge

Final Rank: 3

Final Portfolio Value: $102,112.25 (+2.11%)

Day Trading Strategy For This Contest

For this day-trading contest, my big winners were the triple-leveraged ETFs (Click Here for a list of leveraged ETFs!) [hq]DWTI[/hq] and [hq]JDST[/hq]. [hq]DWTI[/hq] is a triple-leveraged Bear Oil ETF, so when oil goes down by 1%, this ETF goes up by 3%. [hq]JDST[/hq] works the same, but for gold.
With the oil markets so volatile, I knew DWTI, or its partner, [hq]UWTI[/hq], would have some big movement, so I watched the pre-market news and figured prices had a higher chance of going down than up.

For JDST, I always think gold is severely over-valued and love betting against it. I love it even more when that bet pays off!

These leveraged ETFs aren’t very good for long term investments, but if you want to day trade, they can be very interesting choices.

Final Open Positions and Portfolio Allocation

October Stock HoldingsOctober allocation
Click Here To Join The Next Contest!


See More Trading Strategies From This Contest

AWESOM-0’s Third October Daily Contest Trading Strategy - Contest: October Third Daily Challenge Final Rank: 7 Final Portfolio Value: $101,621.37 (+1.62%) Trading Strategy For This Contest For the October 3rd Daily Contest I picked a mix between triple-leveraged ETFs and a few companies that I felt were undervalued. The triple-leveraged ETFs are great for a daily competition because the profits are huge if Read More...
RUINTHERE’s Third October Daily Contest Trading Strategy - Contest: October Third Daily Challenge Final Rank: 1 Final Portfolio Value: $108,724.97 (+8.72%) Trading Strategy For This Contest The strategy I prefer to use is to look for stocks that have been unfairly beaten down. Many stocks are down at any given time and most justifiably so. However, there are those that have become oversold. Read More...
RiskOn’s October Day Trading Strategy - Contest: October First Daily Challenge Final Rank: 1 Final Portfolio Value: $104,671.33 (+4.67%) Day Trading Strategy For This Contest For this daily contest, I purchased 4 ETF stocks, then sold 2 of them once I had a good lead, not wanting to give up all of my gains. My strategy is to purchase the riskiest Read More...
ksmith’s October Day Trading Strategy - Contest: October First Daily Challenge Final Rank: 3 Final Portfolio Value: $102,112.25 (+2.11%) Day Trading Strategy For This Contest For this day-trading contest, my big winners were the triple-leveraged ETFs (Click Here for a list of leveraged ETFs!) [hq]DWTI[/hq] and [hq]JDST[/hq]. [hq]DWTI[/hq] is a triple-leveraged Bear Oil ETF, so when oil goes down by 1%, Read More...
hoabidebay’s First October Week Contest Trading Strategy - Contest: October First Weekly Challenge Final Rank: 1 Final Portfolio Value: $116,943.82 (+16.94%) Trading Strategy For This Contest I select highly volatile and liquid stocks / ETFs to trade, paying attention to how they behave (gap up/down) the 1st 15 min of the opening session. Final Open Positions and Portfolio Allocation Performance Over The Total Read More...
BranFlakes1212’s October Day Trading Strategy - Contest: October First Daily Contest Final Rank: 6 Final Portfolio Value: $101,341.05 (+1.34%) Day Trading Strategy For This Contest I usually focus on Lower priced stocks because they tend to be more volatile. Tuesday however didn’t have very many stocks doing what I prefer to trade, so I pretty much picked one of the top Read More...

Contest: October First Weekly Challenge

Final Rank: 1

Final Portfolio Value: $116,943.82 (+16.94%)

Trading Strategy For This Contest

I select highly volatile and liquid stocks / ETFs to trade, paying attention to how they behave (gap up/down) the 1st 15 min of the opening session.

Final Open Positions and Portfolio Allocation

Blue Chip Stock HoldingsBlue Chip allocation

Performance Over The Total Contest

performance

Click Here To Join The Next Contest!


See More Trading Strategies From This Contest

AWESOM-0’s Third October Daily Contest Trading Strategy - Contest: October Third Daily Challenge Final Rank: 7 Final Portfolio Value: $101,621.37 (+1.62%) Trading Strategy For This Contest For the October 3rd Daily Contest I picked a mix between triple-leveraged ETFs and a few companies that I felt were undervalued. The triple-leveraged ETFs are great for a daily competition because the profits are huge if Read More...
RUINTHERE’s Third October Daily Contest Trading Strategy - Contest: October Third Daily Challenge Final Rank: 1 Final Portfolio Value: $108,724.97 (+8.72%) Trading Strategy For This Contest The strategy I prefer to use is to look for stocks that have been unfairly beaten down. Many stocks are down at any given time and most justifiably so. However, there are those that have become oversold. Read More...
RiskOn’s October Day Trading Strategy - Contest: October First Daily Challenge Final Rank: 1 Final Portfolio Value: $104,671.33 (+4.67%) Day Trading Strategy For This Contest For this daily contest, I purchased 4 ETF stocks, then sold 2 of them once I had a good lead, not wanting to give up all of my gains. My strategy is to purchase the riskiest Read More...
ksmith’s October Day Trading Strategy - Contest: October First Daily Challenge Final Rank: 3 Final Portfolio Value: $102,112.25 (+2.11%) Day Trading Strategy For This Contest For this day-trading contest, my big winners were the triple-leveraged ETFs (Click Here for a list of leveraged ETFs!) [hq]DWTI[/hq] and [hq]JDST[/hq]. [hq]DWTI[/hq] is a triple-leveraged Bear Oil ETF, so when oil goes down by 1%, Read More...
hoabidebay’s First October Week Contest Trading Strategy - Contest: October First Weekly Challenge Final Rank: 1 Final Portfolio Value: $116,943.82 (+16.94%) Trading Strategy For This Contest I select highly volatile and liquid stocks / ETFs to trade, paying attention to how they behave (gap up/down) the 1st 15 min of the opening session. Final Open Positions and Portfolio Allocation Performance Over The Total Read More...
BranFlakes1212’s October Day Trading Strategy - Contest: October First Daily Contest Final Rank: 6 Final Portfolio Value: $101,341.05 (+1.34%) Day Trading Strategy For This Contest I usually focus on Lower priced stocks because they tend to be more volatile. Tuesday however didn’t have very many stocks doing what I prefer to trade, so I pretty much picked one of the top Read More...

Contest: October First Daily Contest

Final Rank: 6

Final Portfolio Value: $101,341.05 (+1.34%)

Day Trading Strategy For This Contest

I usually focus on Lower priced stocks because they tend to be more volatile. Tuesday however didn’t have very many stocks doing what I prefer to trade, so I pretty much picked one of the top gainers of the day when I thought it would spike back later in the day.

Final Open Positions and Portfolio Allocation

October Stock HoldingsOctober allocation
Click Here To Join The Next Contest!


See More Trading Strategies From This Contest

AWESOM-0’s Third October Daily Contest Trading Strategy - Contest: October Third Daily Challenge Final Rank: 7 Final Portfolio Value: $101,621.37 (+1.62%) Trading Strategy For This Contest For the October 3rd Daily Contest I picked a mix between triple-leveraged ETFs and a few companies that I felt were undervalued. The triple-leveraged ETFs are great for a daily competition because the profits are huge if Read More...
RUINTHERE’s Third October Daily Contest Trading Strategy - Contest: October Third Daily Challenge Final Rank: 1 Final Portfolio Value: $108,724.97 (+8.72%) Trading Strategy For This Contest The strategy I prefer to use is to look for stocks that have been unfairly beaten down. Many stocks are down at any given time and most justifiably so. However, there are those that have become oversold. Read More...
RiskOn’s October Day Trading Strategy - Contest: October First Daily Challenge Final Rank: 1 Final Portfolio Value: $104,671.33 (+4.67%) Day Trading Strategy For This Contest For this daily contest, I purchased 4 ETF stocks, then sold 2 of them once I had a good lead, not wanting to give up all of my gains. My strategy is to purchase the riskiest Read More...
ksmith’s October Day Trading Strategy - Contest: October First Daily Challenge Final Rank: 3 Final Portfolio Value: $102,112.25 (+2.11%) Day Trading Strategy For This Contest For this day-trading contest, my big winners were the triple-leveraged ETFs (Click Here for a list of leveraged ETFs!) [hq]DWTI[/hq] and [hq]JDST[/hq]. [hq]DWTI[/hq] is a triple-leveraged Bear Oil ETF, so when oil goes down by 1%, Read More...
hoabidebay’s First October Week Contest Trading Strategy - Contest: October First Weekly Challenge Final Rank: 1 Final Portfolio Value: $116,943.82 (+16.94%) Trading Strategy For This Contest I select highly volatile and liquid stocks / ETFs to trade, paying attention to how they behave (gap up/down) the 1st 15 min of the opening session. Final Open Positions and Portfolio Allocation Performance Over The Total Read More...
BranFlakes1212’s October Day Trading Strategy - Contest: October First Daily Contest Final Rank: 6 Final Portfolio Value: $101,341.05 (+1.34%) Day Trading Strategy For This Contest I usually focus on Lower priced stocks because they tend to be more volatile. Tuesday however didn’t have very many stocks doing what I prefer to trade, so I pretty much picked one of the top Read More...

The October stock contests are finished, with over a thousand participants from all over the world! We had hundreds of thousands of trades placed, and already gave away almost $1000! See who won below!
free stock contest

First Weekly Contest

The Top 5 performers by portfolio value were:

  1. hoabidebay +16.94%
  2. kingsalman+14.36%
  3. brucehaan +14.08%
  4. daniellopez +10.16%
  5. Housemanager +9.83%

The HTMW Team Finishers were:

  • ksmith +0.89%
  • Rossman -0.45%
  • gbrown -5.45%

First Daily Contest

  1. RiskOn +4.67%
  2. LanguageMan1+3.56%
  3. ksmith +2.11% – Not Eligable For Prizes
  4. msr13029 +1.76%
  5. LGarciap03 +1.60%
  6. alexanderkrauss16 +1.42%

The HTMW Team Finishers were:

  • ksmith +2.11%
  • gbrown -0.01%

Second Daily Contest

  1. hoabidebay +4.43%
  2. kingsalman +2.63%
  3. Housemanager +2.59%
  4. AWESOM-O +2.54%
  5. valios +2.26%

The HTMW Team Finishers were:

  • ksmith -1.36%
  • psimard -1.36%
  • gbrown -1.93%

Second Weekly Contest

  1. 2018049n +8.72
  2. cscanlon2013 +7.57
  3. Roboman +7.48
  4. prayerwarrior8507 +7.41
  5. ttietze +5.51

The HTMW Team Finishers were:

  • gbrown +0.08%
  • ksmith -7.40%

Third Daily Contest

  1. RUINTHERE +8.72%
  2. RiskOn +3.16%
  3. NicholasSarkozy +1.84%
  4. htngoog +1.68%
  5. remaleyc +1.68%
  6. MrHenderson125 +1.67%
  7. AWESOM-O +1.62%
  8. dsalkov +1.50%
  9. prayerwarrior8507 +1.49%
  10. dancegirl +1.45%

Fourth Daily Contest

  1. Lschool14 +3.09%
  2. LanguageMan1 +3.06%
  3. 2016046h +2.00%
  4. Spacebounduniverse +1.83%
  5. MichaelGebhart +1.68%
  6. moneyman2000 +1.43%
  7. smithjjj5 +1.33%
  8. 2018049n +1.27%
  9. Dclep13 +1.24%
  10. JohnHOQ +1.23%

See The Trading Strategies From This Contest!

AWESOM-0’s Third October Daily Contest Trading Strategy - Contest: October Third Daily Challenge Final Rank: 7 Final Portfolio Value: $101,621.37 (+1.62%) Trading Strategy For This Contest For the October 3rd Daily Contest I picked a mix between triple-leveraged ETFs and a few companies that I felt were undervalued. The triple-leveraged ETFs are great for a daily competition because the profits are huge if Read More...
RUINTHERE’s Third October Daily Contest Trading Strategy - Contest: October Third Daily Challenge Final Rank: 1 Final Portfolio Value: $108,724.97 (+8.72%) Trading Strategy For This Contest The strategy I prefer to use is to look for stocks that have been unfairly beaten down. Many stocks are down at any given time and most justifiably so. However, there are those that have become oversold. Read More...
RiskOn’s October Day Trading Strategy - Contest: October First Daily Challenge Final Rank: 1 Final Portfolio Value: $104,671.33 (+4.67%) Day Trading Strategy For This Contest For this daily contest, I purchased 4 ETF stocks, then sold 2 of them once I had a good lead, not wanting to give up all of my gains. My strategy is to purchase the riskiest Read More...
ksmith’s October Day Trading Strategy - Contest: October First Daily Challenge Final Rank: 3 Final Portfolio Value: $102,112.25 (+2.11%) Day Trading Strategy For This Contest For this day-trading contest, my big winners were the triple-leveraged ETFs (Click Here for a list of leveraged ETFs!) [hq]DWTI[/hq] and [hq]JDST[/hq]. [hq]DWTI[/hq] is a triple-leveraged Bear Oil ETF, so when oil goes down by 1%, Read More...
hoabidebay’s First October Week Contest Trading Strategy - Contest: October First Weekly Challenge Final Rank: 1 Final Portfolio Value: $116,943.82 (+16.94%) Trading Strategy For This Contest I select highly volatile and liquid stocks / ETFs to trade, paying attention to how they behave (gap up/down) the 1st 15 min of the opening session. Final Open Positions and Portfolio Allocation Performance Over The Total Read More...
BranFlakes1212’s October Day Trading Strategy - Contest: October First Daily Contest Final Rank: 6 Final Portfolio Value: $101,341.05 (+1.34%) Day Trading Strategy For This Contest I usually focus on Lower priced stocks because they tend to be more volatile. Tuesday however didn’t have very many stocks doing what I prefer to trade, so I pretty much picked one of the top Read More...

About The Challenge

The September Monthly Million Challenge is the first in our Monthly Million series, with over a thousand participants from all over the world! The rankings were fierce, with the HowTheMarketWorks team scattered throughout, but you’ll be surprised who won!

If you missed out, you can get the details on our latest monthly challenge, where you can win cash prizes by learning about investing, on our Contests Page (Click Here)!


Rules

  • There will be a full audit at the end of the competition on all winners to verify any corrections due to stock splits, dividends, or any other corporate action our team may have missed. Only legitimate portfolio returns will be counted in the ranking.
  • The usernames of the winners will be made public, but not their actual first name, last name, nor email address.
  • No member of the HowTheMarketWorks Team is eligable for any prizes

Contest: Official September Contest

Final Rank: 5

Final Portfolio Value: $1,119,202.95 (+11.19%)

Trading Strategy For This Contest

My strategy is to look for stocks to short that are moving up (30% +)on news with greater than average volume. So much of the time people get overly excited about the news and drive the price higher and higher. Low float stocks have this happen quite often, an example of this today would be NSPR.
They just did a 1 for 10 reverse split, October 1st, which in itself gives me good reason to short it. They reduced their outstanding shares from 78,000,000 to 7,800,000, float is 7,000,000. Today the share price went from $1.42 a share to $2.12 at its high (a 55% increase), on 13 times its average volume. If you were
watching and lucky enough to short at the high you could have made some money today. A patient person could still make money, I believe it moved up in anticipation of a presentation their Chief Executive Officer, Alan Milinazzo, will give at the Dawson James Securities Growth Stock Conference
on October 15, 2015, other than that there was no reason for the move. When I see something that looks like a possibility, I’ll go read the news. If I decide that the news does not merit the kind of move the stock has made, I’ll check the float, volume, chart, revenue,
debt, if it all checks out I’ll take a short position. My thinking is that if a good return is 7-10% a year when I see a stock up 30, 50,100% or more in a day that’s irrational exuberance. It might not come down that day but it will come down.

Final Open Positions and Portfolio Allocation

Blue Chip Stock HoldingsBlue Chip allocation

Performance Over The Total Contest

performance

Click Here To Join The Next Contest!


See More Trading Strategies From This Contest

AngelRivera’s September Trading Strategy - Contest: September Monthly Million Contest Final Rank: 1 Final Portfolio Value: $1,308,146.64 (+30.8%) Trading Strategy For This Contest My strategy is finding pharmaceutical/biotech companies. I find corporations that are testing products. I look for ones who have an upcoming announcement on phase 3 testing or FDA approvals. I keep those stocks on my watchlist. Once Read More...
smithjjj5’s September Trading Strategy - Contest: Official September Contest Final Rank: 5 Final Portfolio Value: $1,119,202.95 (+11.19%) Trading Strategy For This Contest My strategy is to look for stocks to short that are moving up (30% +)on news with greater than average volume. So much of the time people get overly excited about the news and drive the price higher Read More...
wkaraman14’s September Trading Strategy - Final Rank: 3 Final Portfolio Value: $1,181,543.46 (+18.15%) Trading Strategy For This Contest I used was mainly “gap plays”; I analyze gaps in the premarket everyday, once I determine if the gap will be filled for short term investing, I will place my trade and swing looking for a 10%-20% profit. 90% of all gaps Read More...

Final Rank: 3

Final Portfolio Value: $1,181,543.46 (+18.15%)

Trading Strategy For This Contest

I used was mainly “gap plays”; I analyze gaps in the premarket everyday, once I determine if the gap will be filled for short term investing, I will place my trade and swing looking for a 10%-20% profit. 90% of all gaps fill, the question is when will it fill and when it fills, using key factors such as the history of the chart, market data, support/resistance, news and price action in able to determine if the gap will be filled in just a few days which could offer up to a 30% return in just a few days.

Performance Over The Total Contest

performance

Click Here To Join The Next Contest!


See More Trading Strategies From This Contest

AngelRivera’s September Trading Strategy - Contest: September Monthly Million Contest Final Rank: 1 Final Portfolio Value: $1,308,146.64 (+30.8%) Trading Strategy For This Contest My strategy is finding pharmaceutical/biotech companies. I find corporations that are testing products. I look for ones who have an upcoming announcement on phase 3 testing or FDA approvals. I keep those stocks on my watchlist. Once Read More...
smithjjj5’s September Trading Strategy - Contest: Official September Contest Final Rank: 5 Final Portfolio Value: $1,119,202.95 (+11.19%) Trading Strategy For This Contest My strategy is to look for stocks to short that are moving up (30% +)on news with greater than average volume. So much of the time people get overly excited about the news and drive the price higher Read More...
wkaraman14’s September Trading Strategy - Final Rank: 3 Final Portfolio Value: $1,181,543.46 (+18.15%) Trading Strategy For This Contest I used was mainly “gap plays”; I analyze gaps in the premarket everyday, once I determine if the gap will be filled for short term investing, I will place my trade and swing looking for a 10%-20% profit. 90% of all gaps Read More...

flashing pricesStreaming prices are here!

The “Last Price” on your open positions page is now constantly updating – no more need to keep refreshing the page to get the latest prices!

The price will now flash green if the price went up, red when it goes down. They update every few seconds, so watch carefully!

This enhancement was quite heavy on the HTMW servers – we’ve added a lot more horsepower to the back-end, so the site is now running faster and smoother than ever!

As always, we’re adding small enhancements and some changes every week, so happy trading!

American Apparel ([hq]APP[/hq]) has filed for bankrupsy this morning. It has failed to turn a profit since 2009. Like many other designer brands that once dominated the market among teenage and young adult high-end clothing, its business has been severely weakened as young people’s tastes have changed much faster than the brands can keep up.

And with fashion, once your brand begins to go out of style, it can be nearly impossible to recover. American Apparel has been a stand-out among its peers for two reasons: first, it is one of the only clothing manufacturers to still produce all its wares in US factories, which it uses extensively as a selling point.

The second is its sexually charged advertising, and scandals. The advertising may be par for the course among its rivals, but the scandals are not. Founder and former CEO Dov Charney attracted several sexual harassment lawsuits turing his tenure, which is one of the biggest reasons he lost his post. Other charges include misusing company funds, and assisting with defaming former employees.

The company will continue to operate normally during the bankrupsy, including maintaining its US manufacturing, as it works to convert its debt into equity (trading outstanding bonds in the company for stock), and find new buyers. The operations will likely affected in the long run, but it is not yet clear how.

Want to short American Apparel in your HowTheMarketWorks portfolio? Click here to trade [trade]APP[/trade]!

Read More On Yahoo! Finance

Economics lesson plans are usually the most interesting to students, since it shows how the entire economy around them is flowing! We have some great places to start when you want to talk about economics in your classroom. This also includes lesson plans on taxes.

Economics Lesson Plans For Elementary School And Up

What Are Incentives?

  • Economic Standard Covered: Standard 4 – Incentives
  • Source: EconEdLink, by Connections Cross-Curricular
  • Description: At the core of economics is the incentives for people to do one thing or another. In this lesson plan students identify incentives at home or school, categorize them as “positive” or “negative” and take a look at how they impact their lives

Click Here To Access This Lesson Plan

The ABCs of Saving

  • Economic Standard Covered: Standard 1 – Scarcity
  • Source: EconEdLink, by Patricia Bonner
  • Description: This lesson plan focuses on distinguishing between short-term and long-term goals, and illustrating the opportunity cost between the two. It focuses on creating savings goals, knowing how to store your money, and focusing on building it up to reach your goals.

Click Here To Access This Lesson Plan

Making Cents Out Of Centimes

  • Economic Standard Covered: Standard 7 – Markets and Prices
  • Source: EconEdLink, by Mickey Ebert
  • Description: This lesson plan is a tool for teaching students that most countries build their own currency, along with the Euro, shared by several countries. It also gives an introduction to interest rates, and how $1 is not 1 Euro
  • Using HowTheMarketWorks: HowTheMarketWorks supports having your class portfolio in all kinds of different currencies! Try having your students open a new portfolio in a different currency (or create a second contest in a different currency and have your students join, since all HowTheMarketWorks accounts can join as many contests as you want), and see how the values start moving separately because of the different exchange rates!

Click Here To Access This Lesson Plan

Tic Tac Taxes

  • Economic Standard Covered: Standard – Institutions
  • Source: EconEdLink, by Connections Cross-Curricular
  • Description: This is a basic introduction of looking around at various taxes and services in the community, and identifying how they are all related.
  • Using HowTheMarketWorks: You can have your students use our Home Budget Calculator or Investment Return Calculator to build simple budgets and savings plans with different levels of taxes. For example, ask your students if your town should build a new school or sports arena, and show what impact this would have to each person’s budget or savings plan!

Click Here To Access This Lesson Plan

Who Pays For City Hall?

  • Economic Standard Covered: Standard 10 – Institutions
  • Source: EconEdLink, by Mickey Ebert
  • Description: Students take a virtual field trip to a city hall, and learn about both civil government and how taxes are used to pay for services around town
  • Using HowTheMarketWorks: Similar to above, you can have your students see how an increase in city spending can affect the citizen’s budgets. Since all of our calculators are integrated with our Assignments feature, you can even have them answer the quiz at the end for homework, and see everyone’s progress in your Report Card!

Click Here To Access This Lesson Plan

To Market To Market

  • Economic Standard Covered: Standard 9 – Competition and Market Structure
  • Source: EconEdLink, by Connections Cross-Curricular
  • Description: Students will create a market in the classroom where they can buy and sell goods between each other based on their wants and needs. They can then get a practical experience to see how prices are made and move between consumers
  • Using HowTheMarketWorks: You can also integrate prices for stock into your lesson! Every time a student gets a quote or makes a trade, we show the bid and ask prices for that security, which might be different from the last prices. If the bid and ask are too far apart, no agreement can be reached, and the stock does not trade. This is part of what makes Penny Stocks so risky!

Click Here To Access This Lesson Plan

Country Mouse Makes A Decision

  • Source: EconEdLink, by Mickey Ebert
  • Description: The goal is to create a cost-benefit analysis of Country Mouse on his decisions while he visits the Big City
  • Using HowTheMarketWorks: When your students are putting together their stock portfolio on HowTheMarketWorks, ask them to build a list of stocks they want to buy first. Next, have them only buy half their list at first, and write down why they chose some companies over others!

Click Here To Access This Lesson Plan

Economics Lesson Plans For High School And Up

Fill ‘er up, Please

  • Economic Standard Covered: Standard 8 – Role of Prices
  • Source: EconEdLink, by Abbejean Kehler
  • Description: This lesson shows students how prices are constantly changing, using gasoline as the example. It also covers the basics of supply and demand, and how different components build into the final price.
  • Using HowTheMarketWorks: No prices move as much as stock prices! Have students take a look at the prices moving in their HowTheMarketWorks portfolio, and they can click the “News” button right on the open positions to see what is happening in the world to make that particular stock’s price change.

Click Here To Access This Lesson Plan

Supply And Demand

  • Economic Standard Covered:Standard 7 – Markets and Prices
  • Source: EconEdLink, by Chad Mares
  • Description: Following Fad Toys, students can see how spikes in demand affect prices and the general supply of a good. It follows both the Hula-Hoop fad in the 1950’s, along with Silly Brandz from the last few years, drawing supply and demand charts to visualize the effects.
  • Using HowTheMarketWorks: Your students can also take a look at “Hot Stocks” that surge in value, and then just a few months later come crashing down as investors lose interest! One example is Alibaba stock ([hq]BABA[/hq]), which had the largest IPO in history, followed by losing half of its value in the following months as investors moved elsewhere.

Click Here To Access This Lesson Plan

The Ice Cream Stand

  • Economic Standard Covered: Standard 7 – Markets and Prices
  • Source: EconEdLink, by Michael Koren
  • Description: Students learn about supply, demand, and competition through the example of an ice cream stand. Students then compete by creating their own rival “stands” through the classroom..

Click Here To Access This Lesson Plan

Do you have a great lesson plan you would like to share, or know where we can get more to feature here? Contact our Support Team and let us know!

Savings Lesson Plans

There is no better time to start saving than right now! We have gathered dozens of savings lesson plans together to help your students see exactly how saving and investing will impact their future. All too often young people get started in the “real world” saddled with so much debt that it is hard to grasp what is really going on around them. Avoiding the worst crunches of credit card debt is a great place to start, so give your students a taste of what it means to take out a loan with some of these lessons!

Savings Lesson Plans For Elementary School And Up

You Can BANK on This!

  • Topic:Credit Card
  • Personal Finance Standard Covered: Credit and Debt(Standard 1) – Costs and benefits of different types of credit
  • Source: EconEdLink, by Mickey Ebert
  • Description: Students will assess both negative and positive incentives associated with credit-card use. They will identify profit as an economic incentive for banks to offer credit cards.

Click Here To Access This Lesson Plan

Why Money?

  • Topic: Payment Methods
  • Personal Finance Standard Covered: Spending and Saving (Standard 3) – Describe how to use different payment methods.
  • Source: Kansas City Federal Reserve Bank
  • Description: In this lesson students look at their purchases, and see the difference between paying with cash, checks, credit cards, or other money instruments
  • Using HowTheMarketWorks: The reasons why we use different kinds of money is the same as why we use different kinds of investments. Once your students have a HowTheMarketWorks portfolio, you can talk about the different types of stock, and why different investors might prefer different classes even for the same company.

Click Here To Access This Lesson Plan

Savings Lesson Plans For Middle School And Up

Believe it or Not?

  • Topic: Advertising
  • Personal Finance Standard Covered: Saving and Spending (Standard 4) – Apply consumer skills with spending and saving choices
  • Source: Econedlink, by Patricia Bonner
  • Description: Students will explain the role of advertising from the seller’s point of view,distinguish between fact and opinion in advertisements and view advertisements with a healthy skepticism.

Click Here To Access This Lesson Plan

What’s the Cost of Spending and Saving?

  • Topic: Saving
  • Personal Finance Standard Covered: Spending and Saving (Standard 1) – Develop a plan for spending and saving.
  • Source: EconEdLink, by Sharon Laux
  • Description: Students will learn the benefits and opportunity cost of spending and saving. The will students learn how compound interest makes savings grow. They will learn the benefits of saving and investing when you are young.

Click Here To Access This Lesson Plan

Climbing the Savings Mountain

  • Topic: Saving Money
  • Personal Finance Standard Covered: Spending and Saving (Standard 2) – Develop a system for keeping and using financial records.
  • Source: EconEdLink,Mickey Ebert
  • Description:Students are sometimes clueless when it comes to saving money. It is important that our students learn that saving their money not only helps them achieve financial goals, but actually earns them extra money. In this lesson they will learn that there are a variety of ways in which to save, depending on whether they have short-term or long-term goals.

Click Here To Access This Lesson Plan

Banking Basics

  • Topic: Savings
  • Personal Finance Standard Covered: Spending and Saving (Standard 3) – Describe how to use different payment methods.
  • Source: Boston Federal Reserve Bank
  • Description: In this scenario, students find that their piggy bank has started to fill up. The lesson plan goes through the decisions of spending the cash, finding a bigger piggy bank, or how they can even open their first savings account, along with the advantages and disadvantages of each scenario.
  • Using HowTheMarketWorks: All accounts at HowTheMarketWorks earn 3% interest on the cash that has not been invested. Have your students pick stocks they want to buy, but make sure they consider the trade-off of the 3% they can earn with just the cash, or the extra growth they might get by investing in their preferred stocks.

Click Here To Access This Lesson Plan

Calculating Simple Interest

  • Source: EconEdLink, by Mike Fladlien
  • Description: This is a basic introduction to interest and its calculation for students. It covers a few different interest rate levels and time periods.
  • Using HowTheMarketWorks: We make it interactive! Have your students use our Investment Return Calculator to calculate the growth of savings over time, showing the difference between simple interest and compound interest, and even adjust according to inflation! This is also integrated into our Assignments feature, so your students can answer the quiz at the end and get credit using your Report Card.

Click Here To Access This Lesson Plan

Learning About Credit Card Use

  • Topic: Credit Cards
  • Personal Finance Standard Covered: Credit and Debt (Standard 1) – Analyze the costs and benefits of various types of credit.
  • Source: EconEdLink, by Charlotte Higler
  • Description: This lesson is designed to teach students about what exactly credit cards are and how they work, with time spent on their risks and why people use them.
  • Using HowTheMarketWorks: Our Credit Card Payments Calculator is a perfect supplement to this lesson plan, where students can see the debt repayment of up to 4 credit cards! It is interactive, so they can see the differences in interest rates, minimum payments, and starting cash, and it is integrated with our Assignments feature so you can assign the quiz at the end for homework, and track all your students’ progress in their Report Card.

Click Here To Access This Lesson Plan

Your Credit Card

  • Topic:Credit Card Payments
  • Personal Finance Standard Covered: Credit and Debt (Standard 1) – Analyze the costs and benefits of various types of credit.
  • Source: EconEdLink, by Mike Fladlien
  • Description: This is somewhat similar to the lesson above, but focusing more on picking a credit card based on how long it would take to pay off a hypothetical purchase, given its interest rates and the size of the purchase.
  • Using HowTheMarketWorks: Just like the lesson above, our Credit Card Payments Calculator is great for comparing multiple credit schemes, since it can have up to 4 credit cards with different interest rates calculating at the same time to show how long it would take to pay off a purchase! Since it is integrated into our Assignments, we make it easy to assign as homework.

Click Here To Access This Lesson Plan

The Benefits Of Investing Early

  • Topic: Types of Credit
  • Personal Finance Standard Covered: Credit and Debt (Standard 1) – Analyze the costs and benefits of various types of credit.
  • Source: EconEdLink, by Julie Trivitt
  • Description: This lesson focuses on the benefits of investing early, and how compound interest plays a huge role even with small amounts.
  • Using HowTheMarketWorks: We have three calculators with this lesson in mind, all of them integrated into our Assignments feature. Our Compound Interest Calculator will show how much interest students would earn with their savings over time, our Investment Return Calculator can show the difference between Simple and Compound Interest, while adjusting for inflation, and our Millionaire Calculator can show students what rates of return they will need to achieve to earn a million dollars with the amount of money they can save every month!

Click Here To Access This Lesson Plan

A Penny Saved

  • Topic: Interest growth
  • Source: EconEdLink, by Mike Fladlien
  • Description: These lesson plans walk students through the basics of interest growth and compounding. The second half goes through more complex topics like Real interest rate, returns on investment, and nominal interest rate, but the first half of the lesson is appropriate for younger students.
  • Using HowTheMarketWorks: Our Compound Interest Calculator is great for the first half of the lesson, where students can see how their savings grows over time, while our Investment Return Calculator is great for the second half, since it can be used to control for inflation to find Real and Nominal interest rates. Since these are both integrated into our Assignments feature, it makes it easy to assign as homework, and follow all your students’ progress in their Report Card!

Click Here To Access This Lesson Plan

Credit Cards

  • Personal Finance Standard Covered: Credit and Debt (Standard 1) – Analyze the costs and benefits of various types of credit.
  • Source: Practical Money Skills For Life
  • Description: This lesson plan is designed to introduce students to basic credit card terminology, and learn the basics of shopping for a credit card. They will also be given an opportunity to analyze a credit card statement.
  • Using HowTheMarketWorks: Have your students look up several credit card offers and use their advertised rates in our Credit Card Payment Calculator to see how long it takes to pay off!

Access This Lesson Plan: Teacher Resource, Student Activities, Presentation

Savings Lesson Plans For High School And Up

Credit Reports and Credit Scores

  • Topic: Credit Reports
  • Personal Finance Standard Covered: Credit and Deb (Standard 2) – Borrower’s rights and responsibilities related to credit reports.
  • Source: EconEdLink, by Carrie Hixon
  • Description: Using a Better Money Habits video, this lesson explains the differences between credit reports and credit scores.

Click Here To Access This Lesson Plan

Earning Credit

  • Topic: Credit Score
  • Personal Finance Standard Covered: Credit and Debt (Standard 1) – Analyze the costs and benefits of various types of credit.
  • Source: EconEdLink, by Martha Rush
  • Description: This project has students work through a series of activities and provide them with a simulated credit score and auto loan interest rate. They can then use interest rates and amortization schedules to see the full cost of buying a car, and compare the difference between someone with a high and low credit score.
  • Using HowTheMarketWorks: We have a great Car Loan Calculator that your students can use to find the full cost of buying a car, using various interest rates, cash down, and trade-in values. Its also integrated into our Assignments, so you can assign it as homework and track your students’ progress!

Click Here To Access This Lesson Plan

Fed Boy And The Catastrophe Clan

  • Topic: Credit Card Debt
  • Personal Finance Standard Covered: Credit and Debt (Standard 1) – Analyze the costs and benefits of various types of credit.
  • Source: Kansas City Federal Reserve Bank
  • Description: This lesson is designed to help students know the biggest pitfalls people fall into with credit card debt, along with the biggest government programs designed for consumer protection with credit.
  • Using HowTheMarketWorks: Give your students a balance they need to pay off, like a new TV or some new furniture, and ask them to split it between credit cards with different interest rates using our Credit Card Payments Calculator. They will get a great interactive experience finding the best way to manage their cards, and with the integrated Assignments, its perfect for homework!

Click Here To Access This Lesson Plan

Car Loan Project

  • Topic: Payment
  • Personal Finance Standard Covered: Credit and Debt (Standard 1) – Analyze the costs and benefits of various types of credit.
  • Source: EconEdLink, by Wendy Clark
  • Description: This is a basic exercise examining the process of getting a car loan. Students will look at buying a car using financing, exploring different options for how they will pay for it
  • Using HowTheMarketWorks: Our Car Loan Calculator has a bunch of different financing options, so you can make this whole lesson interactive!

Click Here To Access This Lesson Plan

Loan Amortization – Mortgage

  • Topic: Mortgage
  • Personal Finance Standard Covered: Credit and Debt (Standard 1) – Analyze the costs and benefits of various types of credit.
  • Source: EconEdLink, by Mike Fladlien
  • Description: This is a lesson plan walking through the basics of what a mortgage is, and how to calculate payments using Excel. This is perhaps the most advanced lesson plan on this list, but one that will give students the most hands-on application of using spreadsheets, interest rate calculation, and more tools that are so vital to a healthy understanding of personal finance.
  • Using HowTheMarketWorks: You can use our Buy Vs Lease Calculator to get amortization schedules for annual or monthly mortgage payments, and see the break-even points with renting. It updates automatically, and includes tons of different fee types and rental costs!

Click Here To Access This Lesson Plan

The Credit Card Mystery

  • Topic: Credit Card
  • Personal Finance Standard Covered: Credit and Debt (Standard 2) – Summarize a borrower’s rights and responsibilities related to credit reports
  • Source: EconEdLink, by Dave Koenig
  • Description: This lesson is centered around giving students a better idea of how credit cards work, some of the biggest risks surrounding them (especially for people with multiple cards), and even some of the current government aid programs designed to help consumers manage their credit.
  • Using HowTheMarketWorks: Our Credit Card Payments Calculator allows up to 4 different credit cards, each with different parameters, to see how long it can take to pay off a balance! Its also integrated into our Assignments, making it perfect for homework.

Click Here To Access This Lesson Plan

Do you have a great lesson plan you would like to share, or know where we can get more to feature here? Contact our Support Team and let us know!

Budgeting Lesson PlanBudgeting is perhaps the most essential skill a person can have as they begin living on their own. Whether it is the simple act of balancing a check book, managing bank accounts, or deciding whether it is time to buy or rent, building a budget is the basic core of personal finance. Browse this collection of lesson plans, and find great ways to incorporate HowTheMarketWorks!


Budgeting Lesson Plans For Kindergarten

Alexander, Who Used to Be Rich Last Sunday

  • Topic: Money
  • Personal Finance Standard Covered: Saving and Spending (Standard 1) – Develop a plan for spending and saving
  • Source: EconEdLink, by Mary Suiter
  • Description: In this lesson students will define saving, spending, opportunity cost, and savings goal. They will learn why it can be hard to save money. They will count to 100 by 2s and recognize that $1 equals 100 cents.

Click Here To Access This Lesson Plan

Toys for Me: A Lesson on Choice

  • Topic: Scarcity
  • Personal Finance Standard Covered: Financial Decision Making (Standard 4) – Make criterion-based financial decisions by systematically considering alternatives
  • Source: EconEdLink, by Cindy Crain
  • Description: Students will learn why they cannot have everything they want because of scarcity, they will describe why scarcity is characterized by “this OR that” and not “this AND that” and define opportunity cost.

Click Here To Access This Lesson Plan

How to save and spend money wisely

  • Topic: Money
  • Personal Finance Standard Covered: Saving and Spending (Standard 1) – Develop a plan for spending and saving.
  • Source: Brainpop Educators
  • Description: This lesson plan will help your students learn how to save and spend money wisely. You will be able to empower your students with the skills to be conscious consumers. Help them understand the difference between needs and wants and teach them ways to budget and plan. Practicing financial management skills will help them become more responsible and organized.

Click Here To Access This Lesson Plan


Budgeting Lesson Plans For Elementary School And Up

Goods and Services: Some are Private, Some are Not

  • Topic: Private Business
  • Personal Finance Standard Covered: Saving and Spending (Standard 1) – Develop a plan for spending and saving.
  • Source: Econedlink, by EconEdLink Staff Council for Economic Education
  • Description: Students will distinguish between goods and services provided by private businesses and those provided by government, explain why governments provide certain goods and services and explain that taxes collected by governments are used to pay for goods and services provided by governments.

Click Here To Access This Lesson Plan

How Much Is that Doggy?

  • Topic: Ownership
  • Personal Finance Standard Covered: Financial Decision Making (Standard 4) – Make criterion-based financial decisions by systematically considering alternatives and consequences.
  • Source: EconEdLink, by Kent Steen
  • Description: This teaches student about the total cost of ownership, brainstorming the total cost it will take to buy and keep a dog or cat, and decide which is best for them
  • Using HowTheMarketWorks: Building a budget is important with investing too! Create your contest on HowTheMarketWorks with a small starting cash balance, like $1,000 or $10,000. Next, have your students pick which stocks they want to buy, and determine how much they can afford after subtracting the commission fees. This can be a great way to demonstrate how extra costs can have a big impact, and how buying more of one thing means less of another.

Click Here To Access This Lesson Plan


Allowances and Spending Plans

  • Topic: Budget
  • Personal Finance Standard Covered: Spending and Saving (Standard 1) – Develop a plan for spending and saving.
  • Source: Practical Money Skills For Life
  • Description: This lesson plan helps students build budgets for their allowance, dividing up their money between things like lunches, video games, movies, savings, clothes, and donations to charity
  • Using HowTheMarketWorks: Learning to build a budget is a key part of HowTheMarketWorks! Once your students have joined your class contest, have them divide up their starting cash between different companies that they recognize using the Trading Ideas page. There is even a slider built into trading to help them visualize how much of their available cash they are allocating to each company!

Click Here To Access This Lesson Plan

Click Here For The Student Activity Sheet For This Lesson Plan


Budgeting Lesson Plans For Middle School And Up

Understanding a Balance Sheet

  • Topic: Balance Sheet
  • Personal Finance Standard Covered: Financial Decision Making (Standard 8) – Use a personal financial plan.
  • Source: EconEdLink, by Mike Fladlien
  • Description: Students will learn the components of a balance sheet by working through many problems to strengthen their understanding.

Click Here To Access This Lesson Plan

Budgeting And Income

  • Topic: Accounting
  • Source: Northwestern Mutual, via TheMint.org
  • Description: This is a basic lesson plan to help students understand the differences between fixed and variable costs, different sources of income, and even some basic accounting terminology so they can prepare their own budgets accounting for their living expenses and income
  • Using HowTheMarketWorks: Try including our Home Budget Calculator in your Assignment for your contest. This will give your students practice in building a workable budget in a variety of scenarios, with breakdowns showing how much they have left for savings and investing after taking expenses into account!

Click Here To Access This Lesson Plan

Staying Afloat

  • Topic: Budget
  • Personal Finance Standard Covered: Spending and Saving (Standard 1) – Develop a plan for spending and saving. 
  • Source: EconEdLink, by Michael Koren
  • Description: This is very similar to the lesson plan above, but also has students work through several financial scenarios that will cause impacts to their income or wants and needs. They can then discuss how to best accommodate different strains on their budget.
  • Using HowTheMarketWorks: After using the Budgeting Calculator and building a portfolio on HowTheMarketWorks, have your students re-evaluate their budgeting based on any extra income, or losses, that they have experienced in their portfolio. This can help show that truly workable budgets always require some extra wiggle room for unexpected costs!

Click Here To Access This Lesson Plan

The Art Of Budgeting

  • Topic: Saving Plan
  • Personal Finance Standard Covered: Spending and Saving (Standard 1) – Develop a plan for spending and saving. 
  • Source: Practical Money Skills For Life
  • Description: This lesson plan is designed to help students build a step-by-step plan for saving, starting with a fundamental budgeting process. Students will monitor their spending habits in writing, and learn to make realistic savings goals.
  • Using HowTheMarketWorks: Once students have built a basic budget either on paper or by using our Home Budget Calculator, they can take their savings goals to our Millionaire Calculator to see how much their savings can grow over time. This can help show how even a bit of savings every month can really add up! Since it is all integrated into our Assignments feature, you can assign this exercise as homework and track all students’ progress using the Report Card.

Access This Lesson Plan: Teacher Resource, Student Activity, Presentation

The Higher You Climb, The More You Pay

  • Topic: Budgeting
  • Source: EconEdLink, by Suan Toohey
  • Description: This is an exercise in budgeting, exchange rates, and budgeting. Students will need to virtually climb the Eiffel Tower, starting with less than $13 in their pocket, and pay for admission, the telescope at the top, and water along the way (which gets more expensive the higher you go!).
  • Using HowTheMarketWorks: There are two great ways to integrate HowTheMarketWorks for this kind of lesson. First, you can have your students build a budget using our Home Budget Calculator, but while your students are buying stocks on HowTheMarketWorks, they will get a very clear feel for how certain stocks will get much more expensive, with lower returns, over time, and timing your budget decisions can be almost as important as the budget itself.

Click Here To Access This Lesson Plan


Budgeting Lesson Plans For High School And Up

Using An Excel Checkbook

  • Topic: Excel
  • Source: EconEdLink, by Mike Fladlien
  • Description: This shows students how to build and organize a checkbook, reconciling outstanding payments and deposits
  • Using HowTheMarketWorks: Most students will want to blow off reconciling checkbooks, but by using HowTheMarketWorks, you can show how important it can really be. Have students place trades at night, while the markets are closed, and reconcile their cash balances with the purchases they have outstanding. Then when the markets open the next morning and their trades execute, see how close their estimations of their full value were from what they see in the morning.

Click Here To Access This Lesson Plan

Banks And Credit Unions

  • Topic: Financial Institutions
  • Personal Finance Standard Covered: Spending and Saving (Standard 2) – Develop a system for keeping and using financial records.
  • Source: EconEdLink, by Melissa Smith
  • Description: This lesson plan works to give students a distinction between different financial institutions at a basic level. Your class will work through some of the fundamental differences between two of the most common lenders that people face in their daily lives, and what the differences between them can mean to you.
  • Using HowTheMarketWorks: To get your students thinking about where they should be saving their money, have them take their HowTheMarketWorks portfolio and put some of their starting cash in mutual funds, some in ETF (Exchange Traded Funds), and hold some just as cash (which works like saving it in a long-term money market account). They can then watch their different investments grow at different rates, with different risk, to see how these similar investment vehicles can have very different outcomes depending on what they are looking for when saving.

Click Here To Access This Lesson Plan

Buying Versus Renting

  • Topic: Budgeting
  • Personal Finance Standard Covered: Spending and Saving (Standard 4) – Apply consumer skills to spending and saving decisions.
  • Source: EconEdLink, by John Clow
  • Description: Here we have a simple process to use when someone is thinking about moving out on their own, and deciding if investing in their own property is a better long-term decision than renting.
  • Using HowTheMarketWorks: We make it interactive! Have your students use our Buy Vs Lease Calculator, and answer the quiz at the end to see the tipping point between buying and renting in different scenarios. You can even track their progress with our built-in Assignments!

Click Here To Access This Lesson Plan

Do you have a great lesson plan you would like to share, or know where we can get more to feature here? Contact our Support Team and let us know!

investing lesson plansTeaching about investing in your class? We have you covered! Check out our collection of investing lesson plans, divided up by age group, with great ways to incorporate HowTheMarketWorks into the lessons!

Investing Lesson Plans For All Age Groups

Stock Market and Investing Introduction

  • Topic: Investment basics
  • Personal Finance Standard Covered: Investing (Standard 2) – Evaluate investment alternatives.
  • Source: HowTheMarketWorks, by the HowTheMarketWorks Team
  • Description: This is a “basics of the basics” lesson plan, covering some core investment vocabulary (“Sole Proprietorship”, “Partnership”, “Stock Broker”, ect), building up to core concepts of investing, and all brought together by placing trades on HowTheMarketWorks. It also covers concepts such as “What is a Stock“, how are public companies created, and more.
  • Using HowTheMarketWorks: This lesson integrates trading on HowTheMarketWorks, with some of the core concepts included as part of our Assignments feature.

Click Here To Access This Lesson Plan

Investing Lesson Plans For Elementary School And Up

Buy A Bond, James!

  • Topic: Bonds
  • Personal Finance Standard Covered: Investing (Standard 2) – Evaluate investment alternatives.
  • Source: EconEdLink
  • Description: This is a basic lesson plan talking about what savings bonds are, how the government uses revenue from bonds, and why it might be a good way to start saving as early as possible
  • Using HowTheMarketWorks: We have more resources on Bonds available in our Education Center, but you can also give your students a great interactive assignment by using our Compound Interest Calculator or Saving to be a Millionaire Calculator to show how important it is to start saving early. These are both also integrated into our Assignments feature, so you can easily assign this as homework, and track your students’ progress.

Click Here To Access This Lesson Plan

Saving And Investing

  • Topic: Investment
  • Personal Finance Standard Covered: Investing (Standard 3) – Demonstrate how to buy and sell investments.
  • Source: Practical Money Skills For Life
  • Description: This lesson plan is an introduction to what investment is, and some basic vocabulary like “financial risk” and “rate of return”. The lesson seeks to help students understand that different savings options exist and can have a large affect on their rate of return.
  • Using HowTheMarketWorks: You can use Assignments on HowTheMarketWorks to have your students read basic articles about Stocks, or play with personal finance calculators, like our Millionaire Calculator, that help show how different rates of return can add up big over time.

Click Here To Access This Lesson Plan

Click Here To Access The Student Activity Sheet For This Lesson Plan

Investing Lesson Plans For Middle School And Up

Developing A Financial Investment Portfolio

  • Topic: Personal Finances
  • Personal Finance Standard Covered: Investing (Standard 2) – Evaluate investment alternatives.
  • Source: EconEdLink, by Mickey Ebert
  • Description: Students love nothing more than putting things off, and thinking about their own personal finances are no exception. To get them thinking about it in a whole new light, this lesson plan has your students act as a Financial Adviser to 3 different types of people, and trying to find the best savings and investment plan to fit their individual needs.
  • Using HowTheMarketWorks: One idea that teachers have been using is to create three contests on HowTheMarketWorks, and have each student join all three. The students then need to develop the investment strategy for each of the three types of people in different portfolios, and see how the rates of return and risk change over time!

Click Here To Access This Lesson Plan

Investing Lesson Plans For High School And Up

Owning a Car

  • Topic: Money
  • Personal Finance Standard Covered: Risk Management and Insurance (Standard 2) – Justify reasons to use property and liability insurance.
  • Source:EconEdLink, by Sue Lynn Sasser
  • Description: Using a Better Money Habits video, this lesson introduces students to the various costs associated with buying and operating a car, including monthly payments, gasoline, insurance, and maintenance.

Click Here To Access This Lesson Plan

The NYSE Made Easy

  • Topic: Stocks
  • Personal Finance Standard Covered: Investing (Standard 2) – Evaluate investment alternatives.
  • Source: EconEdLink, by Matthew Wolfe
  • Description: This is a more condensed version of the HowTheMarketWorks lesson plan above, with more information about reading stock quotes. It also includes a short stock project.
  • Using HowTheMarketWorks: You can use our Quotes page for students to get a lot more market news and do more research on any stock they choose, all in one place! There are dozens of other research tools, including detailed quote information (like bid and ask), interactive stock charts, historical prices, and a whole lot more.

Click Here To Access This Lesson Plan

The Five Stages Of Investing

  • Topic: Personal Finances
  • Personal Finance Standard Covered: Investing (Standard 3) – Demonstrate how to buy and sell investments.
  • Source: EconEdLink, by Melissa Smith
  • Description: There are dozens of ways to save an invest, most of them involve balancing the risks and returns of each investment vehicle. This lesson plan is designed to help high school students decide what balance they would like to work with as they prepare for their own future personal finances
  • Using HowTheMarketWorks: HowTheMarketWorks is perfect for practice in building balanced investments. While its easy to see how to invest in Stocks and Mutual Funds, students can also branch out into ETFs specializing in commodities and bonds. Best yet, all cash they have not invested acts like it is in a Money Market savings account, and earns 3% interest. While working through this lesson, it can be great to talk about all the ways students can balance their portfolio, and even see how the markets affect their decisions over the course of the class!

Click Here To Access This Lesson Plan

Understanding And Analyzing An Income Statement

  • Topic: Investments
  • Personal Finance Standard Covered: Investing (Standard 3) – Demonstrate how to buy and sell investments.
  • Source: EconEdLink, by Mike Fladlien
  • Description: Once students have an idea what investing means, this resource will walk through the steps at actually looking at company’s public information to decide whether or not it might be a good thing to invest in, and how to tell companies apart using some very simple reports.
  • Using HowTheMarketWorks: Everything covered in this lesson plan is present in our Quotes Tool, including the income statements and balance sheets of just about every publicly traded company in the United States. Have your students take a look at the balance sheets of companies they invest in their HowTheMarketWorks portfolios, and write a few sentences about why they think what they see makes that company a stronger or weaker investment!

Click Here To Access This Lesson Plan

Here’s Your Chance To Make Millions In The Stock Market

  • Topic: Stock Market
  • Personal Finance Standard Covered: Investing(Standard 2) – Evaluate investment alternatives.
  • Source: EconEdLink, by William Trainor
  • Description: This is the “Here’s Your Chance To Make Your Millions In The Stock Market!” series of lesson plans. This will walk your students through why it is hard to make, or lose, money in the stock market in the long term, showing that while investing can be risky, it can be the best way to build savings in the long run.
  • Using HowTheMarketWorks: This has HowTheMarketWorks written all over it! At each step in each of the lessons, students can perform almost every activity in their HowTheMarketWorks portfolio. Additionally, we have our “How To Become A Millionaire” calculator, which students can use to see exactly what rate of return they need to achieve to reach their goals!

Click Here To Access This Lesson Plan

Part 2
Part 3


Do you have a great lesson plan you would like to share, or know where we can get more to feature? Contact our Support Team and let us know!

Oil price is down again this morning after new stockpile figures show about 4.6 million new extra barrels’ worth of oil went into storage last month, compared to the 100,000 estimate most analysts were expecting.

All this extra oil is going into storage because the global supply, or how much oil producers are pumping out of the ground, is exceeding demand by a wide margin. Oil prices fall because buyers know that sellers are having a hard time unloading their products, so the buyers simply demand lower prices. The producers are hesitant to lower production because they are sure demand is going to pick up soon, but also because they’re waiting for some other producer to cut production first.

Each producer knows that if everyone else cuts supply first, they will get a higher price and more profits. But if they cut first, they will simply lose out on the little revenue they had, so very few are willing to make the gamble. Eyes are still on OPEC to start asking members to cut supply, but no action has been taken yet.

Did you know you can trade oil ETFs on HowTheMarketWorks? Click for quotes of some of the most popular Oil ETFs: [hq]OIL[/hq], [hq]USO[/hq], and [hq]UWTI[/hq]

Apple’s ([hq]AAPL[/hq]) stock price has fallen this week in the wake of the new iPhone launch, which beat estimates to sell 13 million units in its first weekend on the market. This sounds like it should have been great news, so why did the stock price fall?

Well, there’s a few things that investors find worrysome. The first is that while this is indeed a record launch, it isn’t exactly comparing apples-to-apples. China was counted in this launch, while it was excluded from the previous. Adding such a huge market to the numbers is expected to cause them to do up, so just because the number of units sold is bigger doesn’t mean it made a bigger splash than the previous.

Another big problem is that Apple is still relying heavily on the iPhone’s success to continue generating profits. The iPad continues to be popular, but not nearly as obiquitous, while the iWatch is struggling to really gain a following. Investors are somewhat worried that a company that so relies on its image as an innovator might be relying too much on a single workhorse to generate buzz and revenue.

What might be the biggest problem, though, is the product itself. Reviews of the iPhone have been good, but the smartphone market is starting to “mature”: almost everyone who is going to get a smartphone already has one at this point. And while the iPhone 6 and 6S might have some fancy new features, the vast majority of iPhone 5 holders are not going to trade in for a new one until their current one breaks. They are quite expensive, after all. Since there are fewer new customers in the markets, Apple now must struggle to win over Android and Windows Phone users, instead of just grabbing new clients. Since Android and Windows are constantly working to improve their own products, this will always be a struggle compared to the growth of a few years go.

Only time will tell how well this goes in the long run, but Apple stock will continue to be an interesting one to watch!

Click Here To Trade [trade]AAPL[/trade] on HowTheMarketWorks!

Read More at USA Today

Many big companies have been expanding lately, which has helped keep the unemployment rate down, but Whole Foods ([hq]WFM[/hq]) is trying hard to start cutting down.

The big reason for this is that they are starting to get desparate to cut costs: their popular nickname is “Whole Paycheck”, since shopping there for a full load of groceries can drain a full week’s of wages fairly quickly. The brand’s popularity grew very quickly over the last several years as a bastion of organic, non-GMO groceries, so they could get away with higher prices for a more unique offering. However, lately smaller speciality shops offering a smaller selection, but lower prices, have been siphoning off market share, while bigger grocery chains have started expanding their offerings of organic foods, further eroding the brand’s popularity.

These job cuts are aimed mostly at back-end staff, which the firm intends to use the wage savings for a series of technology upgrades.

Click Here to trade [trade]WFM[/trade] on HowTheMarketWorks!

Final Rank: 318 / 518

Final Portfolio Value: $992,114,784.48 (-0.79%)

Investment Strategy For The Blue Chip Investment Contest

Since time was very limited for me in the Blue Chip Investment Challenge. I just tried to get as much profit as possible by trading SPXU and other triple leveraged ETF’s and trying to time the market. Obviously, this strategy is difficult to do without watching the market movements more closely. More judicious use of limit and stop order’s would have been needed. [trade]SPXS[/trade] and [trade]SPXU[/trade] are a great way to multiply earnings. I also traded [trade]ATVI[/trade] (Activision Blizzard) because of strong analyst recommendations and very strong buy on Chaikin analytics. I pulled out before the profits came however because of a large drop in the market. In the end, Activision still proved to be a very good buy and I should have held it longer.

Final Open Positions and Portfolio Allocation

Blue Chip Stock HoldingsBlue Chip allocation

Performance Over The Total Contest

performance

Click Here To Join The Next Contest!


See More Trading Strategies From This Contest

Phil Simard’s Blue Chip Investment Strategy - Final Rank: 318 / 518 Final Portfolio Value: $992,114,784.48 (-0.79%) Investment Strategy For The Blue Chip Investment Contest Since time was very limited for me in the Blue Chip Investment Challenge. I just tried to get as much profit as possible by trading SPXU and other triple leveraged ETF’s and trying to time the market. Read More...
Ross LoGiudice’s Blue Chip Challenge: Lessons from Diversifying - Final Rank: 338 / 518 Final Portfolio Value: $979,922,717.88 (-2.01%) Investment Strategy For This Contest I don’t know if what I did even qualifies as strategy. I purchased about 20 or stocks that were familiar and then I closed my eyes and crossed my fingers. The end result was losses across the board that ranged Read More...
Kevin Smith’s Blue Chip Challenge Investment Strategy - Final Rank: 331 / 518 Final Portfolio Value: $985,785,982.85 (-1.42%) Investment Strategy For This Contest This was a contest where I wanted to go big or crash hard. The news leading up to the contest was dominated by the crash in oil prices, so I figured that there would probably be a rebound coming soon. Read More...

Final Rank: 338 / 518

Final Portfolio Value: $979,922,717.88 (-2.01%)

Investment Strategy For This Contest

I don’t know if what I did even qualifies as strategy. I purchased about 20 or stocks that were familiar and then I closed my eyes and crossed my fingers. The end result was losses across the board that ranged from minor to utterly devastating. The only place I didn’t lose money was with [hq]AAPL[/hq], and even that was simply breaking even. Apple happens to be a Blue Chip stock, which I suppose is appropriate for this contest.

I think the lesson here is nobody should ever trust me to invest their money. Also don’t invest in something just because you use it or it’s popular.

Final Open Positions and Portfolio Allocation

Blue Chip Stock HoldingsBlue Chip allocation

Performance Over The Total Contest

performance

Click Here To Join The Next Contest!


See More Trading Strategies From This Contest

Phil Simard’s Blue Chip Investment Strategy - Final Rank: 318 / 518 Final Portfolio Value: $992,114,784.48 (-0.79%) Investment Strategy For The Blue Chip Investment Contest Since time was very limited for me in the Blue Chip Investment Challenge. I just tried to get as much profit as possible by trading SPXU and other triple leveraged ETF’s and trying to time the market. Read More...
Ross LoGiudice’s Blue Chip Challenge: Lessons from Diversifying - Final Rank: 338 / 518 Final Portfolio Value: $979,922,717.88 (-2.01%) Investment Strategy For This Contest I don’t know if what I did even qualifies as strategy. I purchased about 20 or stocks that were familiar and then I closed my eyes and crossed my fingers. The end result was losses across the board that ranged Read More...
Kevin Smith’s Blue Chip Challenge Investment Strategy - Final Rank: 331 / 518 Final Portfolio Value: $985,785,982.85 (-1.42%) Investment Strategy For This Contest This was a contest where I wanted to go big or crash hard. The news leading up to the contest was dominated by the crash in oil prices, so I figured that there would probably be a rebound coming soon. Read More...

Using the trading view Advanced Chart software will certainly give you an edge.

Don’t forget to trade after doing your analysis!

[chart]

Using the Trading View Advanced Chart

The chart is extremely intuitive but here is a quick tutorial on using it.

Advanced Chart

  1. (if you do not see the left hand panel click on the little arrow on the left hand side in the middle of the graph). Everything on the left panel is for drawing. The tools allow you to draw symbols, lines, shapes, measure distances and zoom in on a certain area. They also include a huge variety of calculated lines and arcs such as Gann and Fibonacci.
  2. This will allow you to change the symbol you are charting
  3. These tabs allow you to change the candle or tick size from 1 minute to 1 month per box or tick.
  4. This provides an incredibly large list of indicators and tools to select from.
  5. This button will allow you to add a symbol on the chart to compare too.
  6. These buttons will take a picture of the graph so you can send it to someone. The button to the right allows you to open a new window of the Trading View Advanced chart.