You can join the next Challenge to win cash prizes by checking out our Prized Contests page (Click Here!), or look below for some of the trading strategies used in this contest:
See More Trading Strategies From This Contest
Phil Simard’s Blue Chip Investment Strategy-Final Rank: 318 / 518 Final Portfolio Value: $992,114,784.48 (-0.79%) Investment Strategy For The Blue Chip Investment Contest Since time was very limited for me in the Blue Chip Investment Challenge. I just tried to get as much profit as possible by trading SPXU and other triple leveraged ETF’s and trying to time the market. Read More...
Ross LoGiudice’s Blue Chip Challenge: Lessons from Diversifying-Final Rank: 338 / 518 Final Portfolio Value: $979,922,717.88 (-2.01%) Investment Strategy For This Contest I don’t know if what I did even qualifies as strategy. I purchased about 20 or stocks that were familiar and then I closed my eyes and crossed my fingers. The end result was losses across the board that ranged Read More...
Kevin Smith’s Blue Chip Challenge Investment Strategy-Final Rank: 331 / 518 Final Portfolio Value: $985,785,982.85 (-1.42%) Investment Strategy For This Contest This was a contest where I wanted to go big or crash hard. The news leading up to the contest was dominated by the crash in oil prices, so I figured that there would probably be a rebound coming soon. Read More...
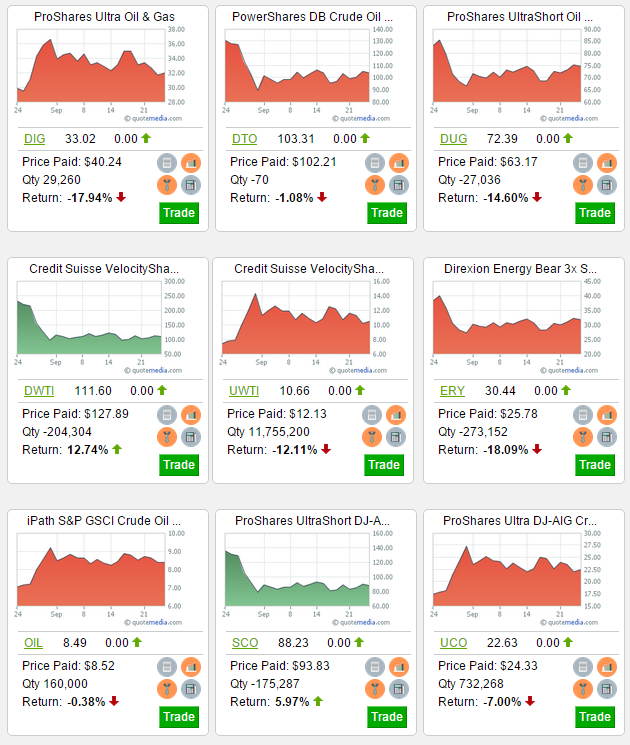
This was a contest where I wanted to go big or crash hard. The news leading up to the contest was dominated by the crash in oil prices, so I figured that there would probably be a rebound coming soon. With that in mind, I bought every double- and triple- leveraged “bull” ETF I could find in the energy sector, and shorted every “bear” ETF they were partnered with.
As you can see by my losses and final rank, this didn’t really work out; there was a brief period where oil prices did recover (you can see my short of [hq]DWTI[/hq], a triple-leveraged bear oil ETF, is one of the few positions I had a net gain), and I actually got up to 16th in the overall rankings, but I did not cash out my earnings before prices started falling back down.
I also had a hard time trying to invest all that cash; these leveraged ETFs can have pretty low volume, so I would have to go back day by day and buy up as many shares as I could in the markets, then go back the next day and try again. Days where oil dominated the news gave me lots of volume to work with, other times I couldn’t really increase my positions at all. This did help prevent my losses from growing, but it also meant it was very difficult to close my positions and “Lock In” any profits.
This is actually a common problem with very large hedge funds in the real world; when you are looking to invest amounts of cash greater than what normally trades in a particular stock in a day, you might end up not being able to find enough sellers to buy from! This is especially the case with options trading.
I tried to learn my lesson, and I will be coming back strong in the September Challenge!
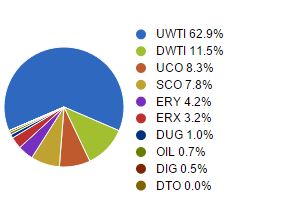
Final Open Positions and Portfolio Allocation
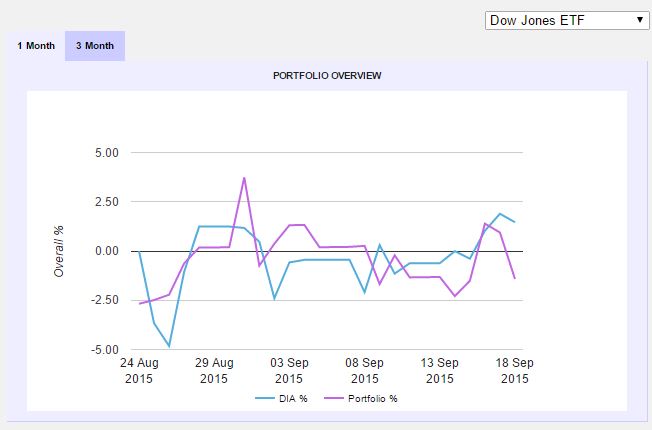
Performance Over The Total Contest
Click Here To Join The Next Contest!
See More Trading Strategies From This Contest
Phil Simard’s Blue Chip Investment Strategy-Final Rank: 318 / 518 Final Portfolio Value: $992,114,784.48 (-0.79%) Investment Strategy For The Blue Chip Investment Contest Since time was very limited for me in the Blue Chip Investment Challenge. I just tried to get as much profit as possible by trading SPXU and other triple leveraged ETF’s and trying to time the market. Read More...
Ross LoGiudice’s Blue Chip Challenge: Lessons from Diversifying-Final Rank: 338 / 518 Final Portfolio Value: $979,922,717.88 (-2.01%) Investment Strategy For This Contest I don’t know if what I did even qualifies as strategy. I purchased about 20 or stocks that were familiar and then I closed my eyes and crossed my fingers. The end result was losses across the board that ranged Read More...
Kevin Smith’s Blue Chip Challenge Investment Strategy-Final Rank: 331 / 518 Final Portfolio Value: $985,785,982.85 (-1.42%) Investment Strategy For This Contest This was a contest where I wanted to go big or crash hard. The news leading up to the contest was dominated by the crash in oil prices, so I figured that there would probably be a rebound coming soon. Read More...
ETFs have been one of the most popular investment vehicles in the world over the last decade or so, with investors of all types attracted to the low fees, but diverse holdings, falling somewhere between mutual funds and stocks in terms of how easy they are to manage in a portfolio.
However, one of the ETF’s biggest strong points, that you can trade it throughout the day like a stock instead of just end-of-day like mutual funds, does come with a bit of an Achilles heel, as many investors found during the extremely volatile trading in August.
With mutual funds, the value of your shares is only calculated at the end of the day, when the portfolio manager re-values all shares based on the underlying holdings. It is a fairly simple procedure (taking the end-of-day values of all the fund holdings), but it means that the fund’s shares cannot trade throughout the day, since the individual investors do not know precisely what their shares are worth until this calculation happens.
With an ETF, the value of the underlying assets changes throughout the day, but since the fund is not actively managed (meaning what your shares actually represent) doesn’t change during the day, you can know the value of its underlying assets at any time. However, ETFs have their own bid and ask based on the supply and demand of the ETF shares themselves as well; this means that during a “panic sale”, the shares of the ETF can fall much more quickly than its underlying assets. This was particularly the case with a Blackrock ETF called iShares Select Dividend ETF (DVY), which fell by over 30% during a very short panic, while its underlying assets only fell by about 3%.
While this makes an opportunity for arbitrage, it also means that investors buying an ETF to take advantage of its holdings can get hit by some very big shocks that are not part of what they originally thought they were buying; if you held DVY during that time it crashed and had a stop order in place, you would have sold out of your position at a huge loss, when the underlying assets that you thought your value was based on really did not drop by very much.
Investors are watching how ETF companies manage these kinds of issues, if this is not addressed, it could be a huge risk that investors do not particularly want to take!
We have always been firm believers that it is great practice to continue trading even after your classes end, and we’re starting a new program of monthly stock contests to help support that!
These contests are open to everyone – just join for free and start trading! You can find the most up-to-date contest information on our Prized Contests page.
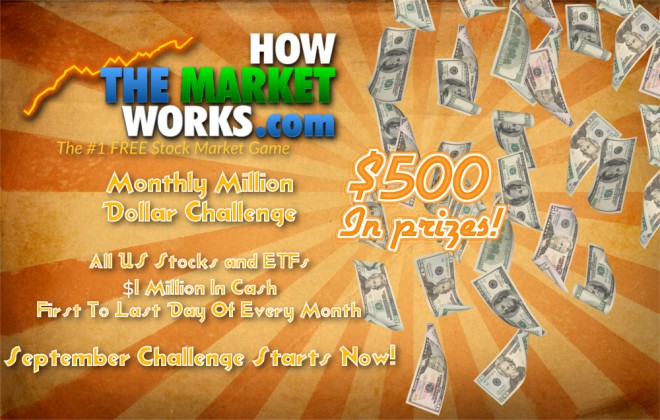
Here’s now it works – Starting on the first Monday and lasting until the last Friday of every month, everyone who enters will get $100,000 to $1,000,000 to invest in any US stocks or ETFs that they wish. They will compete against other HowTheMarketWorks users and the HowTheMarketWorks team for a shot at $500+ in prizes. The actual prize amount will increase depending on how many people are registering and trading. We might also run shorter or longer contests each month.
Students and classes are encouraged to participate, there will be new chances to win every month!
These new contests also come with some enhancements to the trading page – now we will be using a slightly different value on the trading page than what we use on your My Portfolio page. The reason for this is that we’re calculating the values for so many accounts at a time – the Rankings page will update a bit more slowly than your Open Positions page. This is to make sure the ranking are always accurate, and the site stays running at peak efficiency.
Click Here for the next contest details, and happy trading! As always, we’re putting in place tons of small changes and bug fixes every week on top of our major updates.
Fibonacci Arcs and retracements are used as a technical indicator to determine support and resistance. As with most indicators it can be used to see if a breakout has occurred or if a reversal is likely to happen.
Fibonacci Number
To understand the Fibonacci arcs and retracements, we must first understand where the Fibonacci numbers comes from. The Fibonacci numbers are found by starting with 1,1. The next number in the sequence is found by adding the previous two numbers. To see it in action, consider this sequence of Fibonacci Numbers:
We can use these numbers to determine ratios. As the numbers in the sequence get larger, the ratio between them converges to a constant. These ratios for the basis for the Fibonacci arcs and retracements.
By dividing a number by the number after it (ex:610/987) we will get 0.618.
By dividing the number by two after it (ex:610/1957) you get 0.382.
By dividing a number by the number before it we get 1.618.
Note:Other numbers can also be found by varying the numbers we use in the sequence.
These numbers are extremely important not just in finance, but in nature as well and can be seen nearly everywhere. (1.618 and 0.618 is termed the “Golden Ratio” because 1/1.618 = 0.618 among other things). In statistics, the percentage of a sample population found in a normal distribution in within half a standard deviation is 38.2% (which is what you get when you divide a Fibonacci number by two before it). The sheer amount of times we see these numbers in nature and elsewhere is enough to give some credit as to the use of the Fibonacci sequence.
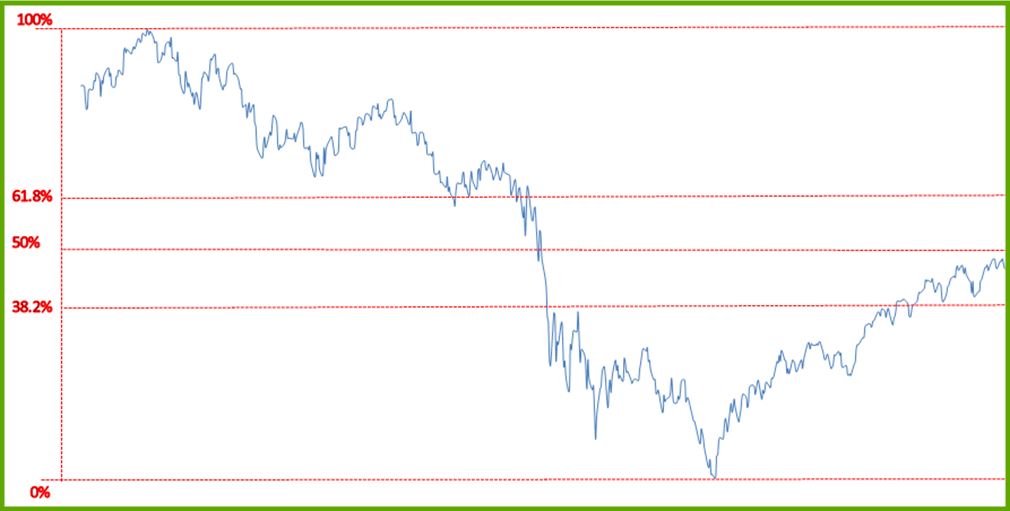
Fibonacci Retracement
This tool, though less useful than the Fibonacci arc, can be used to determine likely support and resistance levels and can help with past chart patterns as well.
Drawing lines at the high a low, and at 38.2% 50% and 61.8% will provide important support and resistance.
As we can see below, though useful, the retracement only provides so much information and is generally less useful than drawing your own support and resistance lines.
What’s important here is that you can see is on the way down the stock went through three lines very quickly but stayed in the top and bottom tiers for quite a long time.
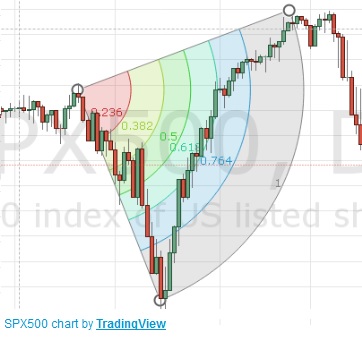
Fibonacci Arc
Fibonacci Arcs are far more useful as they take into account the time as well as the price.
From this graph we can see that the arc follows the 61.8% line very closely before it cuts into the next percentage area. This is very predictable since it couldn’t possibly continue to rise at the rate it was and was a support arc for that period. As with most technical indicators, Fibonacci Arcs and retracements are a tool among many others. They may provide lots of information in one graph and very little in another. What’s important to note is that it would very unlikely for the trades to go from the 100% arc to the 50% arc without some time passing by.
The Dow Jones Industrial Average futures had a big bump this morning, based on market data coming from China and Japan. Both countries recorded big gains today. The good feelings extended over Europe, with French and German indexes gaining over 2% each.
The news comes after the Chinese government announced measures aimed at stemming the volatility and sell-offs. These measures have plagued the Chinese markets over the past few weeks. Most analysts are expecting the measures to continue, which has investors around the world relieved. If this does in fact continue, we could see the Dow Jones gain even more tracking.
Impact of the Chinese economy – Specifically the Dow Jones Industrial Average
Regardless of country, almost everyone has some stake in Chinese investment, so good or bad news in their financial sector tends to ripple around the world. This phenomenon will be the catalyst of stock market volatility in the weeks and months to come. The Chinese market has become extremely important to the overall health of global markets.
Later this week, a key Apple ([hq]AAPL[/hq]) meeting is set to take place where investors are expecting a new product or update launch, important labor market reports are expected from the Bureau of Labor Statistics (BLS.gov), and several other smaller companies are having their earnings releases (like Krispy Kreme [hq]KKK[/hq] and Quiksilver [hq]ZQK[/hq]). This should make for a very interesting week in the U.S. markets.
The interest rates set by the Federal Reserve Bank have been pegged near zero for many years now, and investors are signalling that they are ready to see it go up.
During the financial crisis, interest rates were slashed down to historic low levels as the Fed did everything in its power to ease lending and help spur the economy back into recovery. Beyond cutting interest rates, the Fed embarked on other programs, such as bond-buying, to try to inject more cash into the economy. However, as markets improved, it has been trying to find a way to start backing out of its “emergency” position.
The bond-buying program of “Quantitative Easing” ended several months ago, but they still have not been able to raise interest rates back to “normal” levels. One major reason is that there has not been enough inflationary pressure to justify it, but another major concern is that the shock of raising interest rates could hurt growth as money becomes more expensive to borrow.
However, the bonds market, the leading indicator as to how the market as a whole will react to changes in interest rates, is holding steady ahead of next week’s meeting, where most analysts expect the rates to finally start to rise. Bond investors are the most sensitive to interest rate changes; as the interest rates on government bonds change, the yields bond investors rely on are impacted directly. Stable bond markets ahead of potential interest rate increases sends a strong signal that the markets are ready for what the Fed throws at them.
If you want to get exposure to bond trading on HowTheMarketWorks, you should check out some Bond ETFs! These include:
[hq]BND[/hq]: [trade]BND[/trade] and [hq]LQD[/hq]: [trade]LQD[/trade]
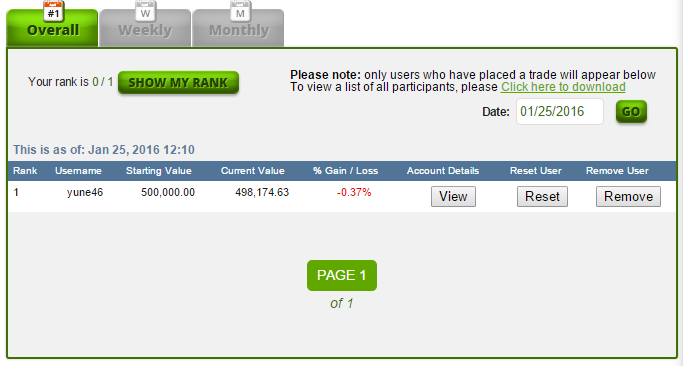
You’ve asked, and we listened! With this most recent update, teachers have more tools than ever to manage their classes on HowTheMarketWorks. You can access all these new tools from the Rankings page when you’re logged in as the contest creator.
Next to each user on the page, you have 3 new buttons: “View”, “Reset” and “Remove”. The “View” button will let you see this user’s transaction history, open positions, and an estimate of how much they made or lost on each trade. You can export all of these reports to excel too!
The “Reset” button will remove all the user’s trades and act like they have just joined for the first time. This is great if you want to give your class a “Practice Session” before starting your class contest for real.
The last button is to remove a user who joined your class by mistake. Users that have been removed cannot re-join the contest and will no longer appear in the class rankings.
We have also added a small new feature for all users – you can now quit any contest you’ve joined. The button to do so is also on the Ranking page, right next to the “Show My Rank” button.
There are many contest creators who are looking for a way to see everyone who has joined their contest, regardless of whether or not they have made a trade. We’ve added a button on the Rankings page that will download an excel spreadsheet showing all the users who have joined your contest, along with their first and last name, so it is easy to see any users who might have correctly joined your contest, but haven’t yet placed their first trade.
As always, there have been tons of small bug fixes and enhancements put on the site every week. Happy trading!
Times have been changing rather quickly for the alliance between the United States and Saudi Arabia.
The main reason is energy. US dependence on Saudi Oil has been dropping rapidly in the last decade, dropping by 50% thanks largely to increased oil production in America (if you want to try trading oil on HowTheMarketWorks, check out the [hq]OIL[/hq] ETF!). Saudi Arabia once was a major force for US policy makers to contend with; it is a leading member in OPEC, the consortium of many oil producers that coordinates production to try to ensure stable prices for its member countries, and from the mid 1970’s until very recently the United States was very depended on imported Saudi oil to keep its engines running. Many Saudi fortunes were also made when gas prices spiked in the mid-2000’s.
However, in the last few years the dynamic has been changing rapidly. The United States just has not been demanding as much oil as it used to, which is coupling with the massive drop in oil prices to have a huge impact on the Saudi budget (another popular oil ETF is [hq]USO[/hq], [trade]USO[/trade]). This comes as the United States has withdrawn troops from Iraq, and so is less reliant on Saudi military bases for supplies and logistics. There has also been tension because the Saudis would very much like the US to become more actively involved in in military campaigns in Syria, and the recent nuclear treaty with Iran, Saudi Arabia’s historical rival.
The Saudi King Salman will be in Washington today to discuss these policies and others with President Obama, but the balance of power at the table will be very different than it may have been just a few years ago.
The next 5 days will be a very important learning experience for traders trying to sift through the rubble after China’s highly-publicized currency devaluation and subsequent shockwaves through the world markets.
American markets have begun their recovery, with the S&P 500 (ETF: [hq]SPY[/hq]) and Dow-Jones (ETF: [hq]QQQ[/hq]) indecies both recovering some of the losses. However, the next few days will be critical for one big reason: the markets will not be open at the same time, so there should not be any spillover effects.
China is currently engaging in World War Two victory anniversary celebrations, closing the stock exchanges while the events take place. After that, the US markets will be closed for Labor Day, effectively segragating the actual market forces from each market to itself. This means that Chinese instability cannot cause serious intra-day trading jumps in the US, and equity flows in the US will not work for or against Chinese markets.
If you want to invest in Chinese assets on HTMW, check out the [hq]MCHI[/hq] ETF, which is heavily focused on Chinese mid-sized companies!
Stock index futures are up this morning as investors are starting to see buying opportunities after the big losses last month that stemmed from China’s stock crash and currency unrest around the world. However, investors are beginning to think that the initial sell-off was a bit of an overreaction; stock index futures are used to measure how investors feel the market will move in the near future. As investor confidence goes up, so do index futures, so when we see these kinds of increases we know the market is starting to lean towards growth.
Lots of government reports were also released today; 190,000 jobs were created in the US, although that missed the estimate of 210,000. Long-range Treasury bond yeilds moved slightly higher, but shorter-term bonds stayed the same. This usually means that the bond market thinks equities will be more attractive in the near future, but not much money has been moved from bonds into stocks just yet.
728×90 superawesome
If you want to buy into a stock index, try trading an Index ETF like SPY for the S&P 500, or QQQ for the Dow-Jones Industrial Average! Click Here for more popular Index ETFs that you can trade on HowTheMarketWorks!
Forex or (FX) is the term used for the world’s currency market. It comes from the words Foreign Exchange. Unlike stock exchanges like the New York Stock Exchange (NYSE), there is no physical location for the Forex market, instead it describes the inter-bank or Over-the-counter (OTC) market for currencies. Currencies trade 24 hours a day, five days a week (Sunday night to Friday night). Forex trading is the largest market in the world, but also has the most volatility.
Currencies are always traded in pairs; you must trade one currency vs another. For example, if we bought USD/EUR for 1.2 it would mean you need 1.2 US dollars for 1 Euro. Similarly the EUR/USD would be the inverse of that, or 1 over 1.2, meaning that to buy 1 USD you would need 0.8333 Euro.
Leverage
Forex trading is considered very risky because most Forex trading is done with 20, 50 or even 100 times margin meaning that you are exposed to a very large amount of leverage. This means that for every dollar you put down of your own money to open a position, you are borrowing another $19, $49, or $99 from your Forex brokerage.
Brokerages will loan you this money because you are trading currencies, so the value is inherent, and all of the risk is passed on to you. For example, if you have a 50 times leveraged account, if the exchange rate falls by 1%, you can lose 50% of your initial investment! You can also have the opposite case with a winning trade, but the number one priority of all investors is capital preservation; maintaining and growing the money you invest. By exposing yourself to such a high loss, you can walk away losing almost everything very quickly.
Most professional investors use an 8x or lower margin, higher amounts are usually used by beginners with very small accounts or people with many positions and want to utilize the risk of loss for the rewards.
How To Practice Trading Currencies For Free
Trading currencies takes lots of practice to get it right! There are a few ways to practice for free:
Set up a contest on HowTheMarketWorks with a different currency
Set up a trading contest on HowTheMarketWorks, but switch your currency to something else. We have over 30 to choose from, with all prices updating at the current FX rate! Once you have practiced investing in things you are familiar in using currencies you are not, you will have a better understanding of how to work with currency pairs
Use Virtual-Stock-Exchange to practice buying and selling Currency Spot Contracts
You can practice trading currencies directly, along with trading stocks and ETFs from over 30 global exchanges, by using our Global site: Virtual-Stock-Exchange. Virtual-Stock-Exchange, or VSE, works almost the exact same as HowTheMarketWorks (create your own contest, see real-time rankings, get all kinds of quote and research tools), but instead of Mutual Funds, it has Global stocks, along with currencies and some commodities (like Gold and Oil) in the form of “Spot Contracts”.
Spots are like Forex, but without the margin and leverage, so it is perfect for beginners looking to practice trading currencies.
Comparing Forex Brokers
If you want to trade forex for real, it is important not to just get practice first, but also to choose the right broker for you. There are many ways to compare forex brokers, but Australian investors have an awesome comparison tool available at https://www.compareforexbrokers.com.au.
The September Monthly Million Challenge is the first in our Monthly Million series, with over a thousand participants from all over the world! The rankings were fierce, with the HowTheMarketWorks team scattered throughout, but you’ll be surprised who won!
The Top 5 performers by portfolio value were:
AngelRivera+30.81%
Janene+23.14%
wkaraman14+18.15%
puttno2+12.63%
smithjjj5+11.19%
The HTMW Team Finishers were:
ksmith+0.12%
psimard-1.60%
Rossman-0.45%
TeamHTMW-0.64%
gbrown-24.84%
See The Trading Strategies From This Contest!
AngelRivera’s September Trading Strategy-Contest: September Monthly Million Contest Final Rank: 1 Final Portfolio Value: $1,308,146.64 (+30.8%) Trading Strategy For This Contest My strategy is finding pharmaceutical/biotech companies. I find corporations that are testing products. I look for ones who have an upcoming announcement on phase 3 testing or FDA approvals. I keep those stocks on my watchlist. Once Read More...
smithjjj5’s September Trading Strategy-Contest: Official September Contest Final Rank: 5 Final Portfolio Value: $1,119,202.95 (+11.19%) Trading Strategy For This Contest My strategy is to look for stocks to short that are moving up (30% +)on news with greater than average volume. So much of the time people get overly excited about the news and drive the price higher Read More...
wkaraman14’s September Trading Strategy-Final Rank: 3 Final Portfolio Value: $1,181,543.46 (+18.15%) Trading Strategy For This Contest I used was mainly “gap plays”; I analyze gaps in the premarket everyday, once I determine if the gap will be filled for short term investing, I will place my trade and swing looking for a 10%-20% profit. 90% of all gaps Read More...
About The Challenge
The September Monthly Million Challenge is the first in our Monthly Million series, with over a thousand participants from all over the world! The rankings were fierce, with the HowTheMarketWorks team scattered throughout, but you’ll be surprised who won!
If you missed out, you can get the details on our latest monthly challenge, where you can win cash prizes by learning about investing, on our Contests Page (Click Here)!
Prizes
Each of the top 5 portfolios won $100 Amazon gift cards!
Rules
There will be a full audit at the end of the competition on all winners to verify any corrections due to stock splits, dividends, or any other corporate action our team may have missed. Only legitimate portfolio returns will be counted in the ranking.
The usernames of the winners will be made public, but not their actual first name, last name, nor email address.
No member of the HowTheMarketWorks Team is eligable for any prizes
See The Details Of Other Contests!
Fall 2017 Challenge-Win prizes in our stock market contests! Find all of the information for any stock contests with prizes we are currently running here! You can also find information on past contests and their winners. Register Here To HTMW Fall Challenge Who can join? Anyone can join! Joining our stock market contests is completely free, so Sign Up Read More...
Back To School Challenge-Our Back To School Challenge is now finished, we had tens of thousands of trades placed to fight for the top spots! See the winners below! If you want a shot at a cash prize yourself, join our next contest! Click Here To Join The Next Contest! Stock Trading Contest Result Fractals7 Namburiv Catspaws Igorski123 Read More...
April Trading Contest-Our April Trading Contest is now finished, we had tens of thousands of trades placed to fight for the top spots! See the winners below! If you want a shot at a cash prize yourself, join our next contest! Click Here To Join The Next Contest! Stock Trading Contest Result TJack43 EddieB18 Housemanager brucehaan wolforda17 About Read More...
March Trading Contest-Our March Trading Contest is now finished, we had tens of thousands of trades placed to fight for the top spots! See the winners below! If you want a shot at a cash prize yourself, join our next contest! Click Here To Join The Next Contest! Stock Trading Contest Results MichaelGebhart +53.77% wpeldiak +50.55% Janene +31.00% Read More...
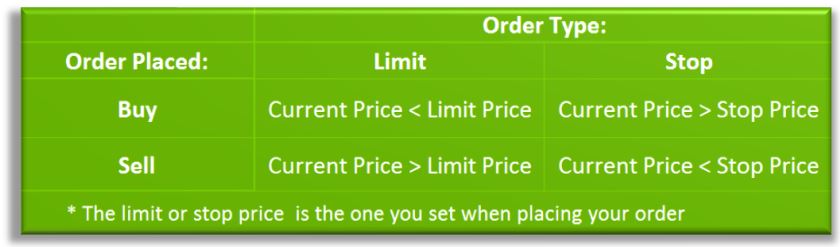
A Stop (or stop loss) order and limit order are orders that try to execute (meaning become a market order) when a certain price threshold is reached. Limit and stop orders are mirrors of each other; they have the same mechanics, but have opposite triggers.
When creating a limit or stop order, you will select a ticker symbol and quantity, just like a market order, but you will also select your target price as well. The target price is the price that triggers the limit or stop. Setting a target price does not guarantee you will get that price, it just means a market order will be created at that time. If there is not enough volume in the market to fill your order, it still may not execute.
Limit
A limit order will set the maximum price I am willing to buy (cover) at or the minimum price I am wiling to sell (short) at.
Example
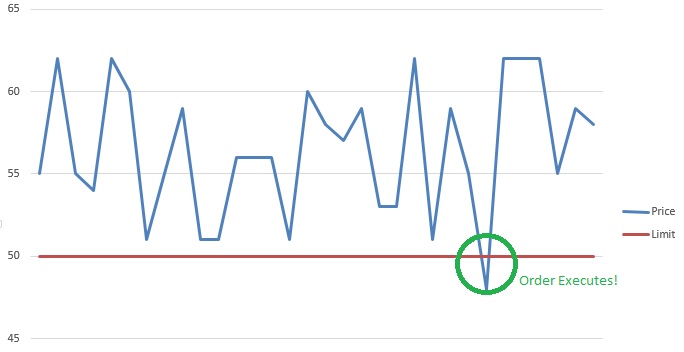
Let’s say Verizon (VZ) is at $50, but you think it is overpriced and want to buy it once it falls. By setting a limit order at a target price of $45 we can wait until the price reaches that without having to sit in front of a screen. As long as the price is greater than $45 it will not execute. As soon as the price drops to $44, your stop order becomess a market order, filling at $44.
Here is a chart showing how a limit buy order works, showing a sample stock’s price over the course of a day:
A stop order will set the minimum price I am willing to sell, or short a stock. It can also mean the maximum price at which I am willing to buy, or cover.
Example
Let’s say you own PayPal stock (PYPL) that you bought at $25. If the current price is $31, you want to keep holding the stock in case the value continues to rise, but you do want to protect the gains you made.
You can put a Stop Sell order with a target price of $30, so if the price of the stock falls to $30, you will be protected from any more losses. If the value continues to rise, you will continue to hold the stock.
The table below can be an easy reminder of when a stop or limit order will execute.
Uses
Stop and limit orders will help you protect you from loss, or help you take advantage of a gain, as well as give you access to more advanced trading strategies.
One of the greatest advantages of stop and limit orders is that they can be set and left with Good Til Cancel (GTC) order expiration, and thus you don’t have to watch the stock price constantly to get well-timed trades. If prices change past your limits, the orders will execute automatically, giving you less to worry about.
This also means that you can build a much wider portfolio. If you do not need to constantly watch the price of every single one of your holdings and watchlist items because you have already set up limit and stop orders based on your preferences, you can have a much larger range of symbols on your radar.
Another important use is that you can take some of the emotion out of your trading. By setting limits and stop orders beforehand, you don’t have to panic sell or panic buy to take advantage of price swings; you already will have standing orders ready to spring into action when your pre-determined criteria are reached.
In a move that suprised almost no-one, OPEC announced that cuts in production to help prop up oil prices may soon be on the horizon.
What was surprising was that US oil producers, who are not affiliated with the group, concurrently cut back production estimates. The change in US estimates is mostly technical; instead of relying on state research and computer models, the new accounting estimates based on what actual drillers in a few key states are predicting based on the conditions on the ground.
Both cuts come at a time when oil is near its 6-year low point, oil producing countries around the world have been feeling the bite with constantly-low prices. Many oil producing countries in the Middle East are members of OPEC, an organization that works to maintain stable prices for producers. In North America, Canada and the United States are both major oil producers, with the Canadian economy being especially hard-hit by low prices and the global supply glut. In Europe, Norway is one of the biggest producers, with government officials calling the recent price crash “worse than the financial crisis” for the Norwegian economy.
Russia is the world’s leading energy exporter, and the collapse in prices has been devistating to their economy, just as sanctions from Europe over Crimea and Ukraine began over a year ago.
Alibaba (BABA) has had a wild ride since its IPO last year. Today, shares are up about 3% from the first day of trading, although that pales in comparison to the heights in November, where they hit about 75% higher than today.
Since November, prices have crashed down; their growth is still strong, but investment firms and hedge funds are having a hard time valuing the Chinese e-commerce giant. One of the major issues is how to value potential revenue growth; one of the most appealing parts to buying into fast-growing companies is also what makes them the most risky. Most of the value of the stock is rooted in how much investors expect the company to grow in subsequent years, which places a lot of value in speculation on what their market will be like 1, 3, or 5 years down the road.
Alibaba is feeling this cut now. Some of its biggest investors, large American hedge funds, are starting to dump their shares and look elsewhere, namely JD.com (ADR), which has the same market niche as Alibaba, but a very different business model, and much faster growth in the last year.
So what gives? Investors are looking for the highest return, and Alibaba is feeling the cut of changing market sentiment. JD is “Hot”, a small upstart that is gaining market share and attention quickly, while Alibaba, the darling of investors all over the world last year, is suddenly “Old News”, and needs to re-prove its worth to keep investment dollars coming in.
Yesterday index futures around the world started pushing up after China announced a cut to interest rates and banking reserve requirements. That trend continues today, with stock prices in Europe and North America pushing ahead and erasing losses from the past week. China, however, is looking at a different story.
The Shanghai Composite Index fell a further 1.3% as of Wednesday morning, with almost 5 trillion in equity erased in the last week of trading. Since June, about half the value of all Chinese stocks has disappeared. Most investors agreed that the Chinese markets, both stocks and property, have been caught in an increasingly-unstable bubble, and the massive loss in equity is a reflection of that bubble bursting. This has been made worse by bad economic news; China is looking at the lowest growth rates in decades, leading investors to further question why equity prices were rising so high in the first place.
In the near term, stocks around the world are beginning to recover, but the bad news is yet from over for China.
An order type that allows to set a moving stop or limit target price. The target price moves based on the daily high. Trailing stops can be set either in percentage or in dollars and cents terms. When in dollar terms it will activate when the price has moved by the target you have set relative to the day’s high.
Example
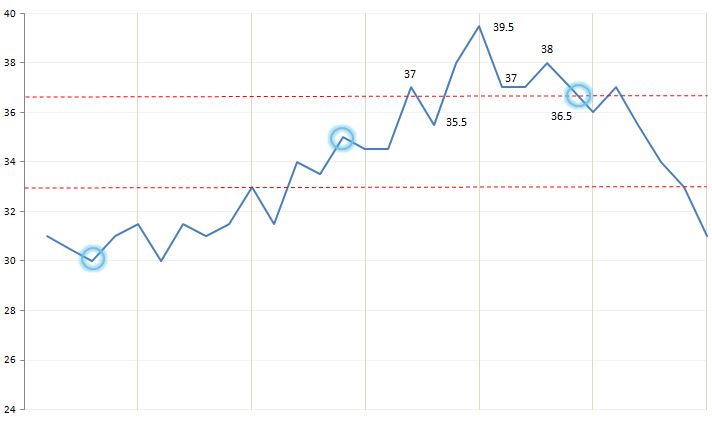
Let’s say we bought a stock for 30$. The stock then climbs to 35$. We don’t think it will go much higher but we do not want to lose our profit either. We could then set a trailing stop order for 3$. This will act just like a normal stop order. Selling at your target price. Here, however, your target (moving) price is 3$ and when the price is 35$ it will trigger at just below 32$. As we will see though, it changes based on the high:
We’ve set our trailing stop at the second bubble. Currently our selling point is 32$. The price then goes up to 37$. The new stop order will occur at 34$ (shown by the lower red dotted line). However, the price continues to go up to 39.50$ making our stop target price 36.50$ The price moves down and then back up to 38$ but this will not affect your trailing stop since it is not higher than the previous high. Thus our stop target is still 36.50$ which will be activated at which point we fall just below it.
Similarly, we could have use a percentage trailing stop. This will act just as it did previously but the target will change based on the high price. Hence if we used a 10% trailing stop in the example above. Our exit would have been at 39.50 – 10% * 39.50 = 35.55$. Percentage trailing stops can be very useful to help protect you if your price has increased considerably. For example, a 1$ trailing stop might be fine at 10$ but wouldn’t be if your stock had increased to 100$. You would be sold out of your position far too early.
Note: There are many variations that can be made with trailing stops with advanced trading software. You can change the high’s and the duration by tick size or have different ways of calculating the target price. This is far more complex however and requires a very experienced trader.
Stocks around the world this morning after the Chinese central bank announced interest rate cuts, along with lowered reserve requirements for banks to encourage banks to start lending and put a stop to the global equity selling spree.
This comes a week after the same bank drastically de-valued the Yuan, sending stocks, currencies, and futures around the world spiraling downwards. Yesterday the Dow had the biggest single-day drop in history, although it had somewhat recovered by the time trading halted.
So why cut interest rates? Central banks use interest rates and reserve requirements in their quest to constantly balance economic growth with inflation; having low interest rates makes it very cheap for people and businesses to take out loans, which can become the engine for economic growth.
Reserve requirements are what banks are required to keep in their valults and not lend out; when reserve requirements are lowered, more cash is available for banks to lend, which again can help drive growth.
However, this can come at a cost; if too many loans are taken out at the same time, it injects a lot of cash into the economy all at once, which raises prices and causes inflation. Too much inflation means that all that economic growth is lost to higher prices; instead of more economic activity, it is the same work done with bigger numbers.
These two counter-acting results mean that when the economy is strong, central banks try to raise interest rates as high as possible without hurting growth to prevent too much inflation. When the economy is weak, they lower interest rates as much as possible without causing too much inflation.
The higher the interest can get during the periods of strong growth, the more “room” the central banks have to help drive growth when the economy is weak by lowering the rates. If the interest rates are already near 0 when the economy starts to get weak, there are far fewer tools central bankers have to help get things running again.
Stocks around the world continued to lose value, over $5 trillion in value has been lost in the last 2 weeks, as investors continue to flee riskier assets after China’s currency devaluation.
The move, which many have claimed was a move designed to boost exports, has caused waves all around the world. Investment to developing countries has been especially hard hit, with Kasakhstan the first country to experience rapid inflation in its wake.
So what happened?
China devalued its currency; meaning it lowered its exchange rate compared to other countries, by over 6% in a span of a few days. From an import-export perspective, 1 US dollar now buys 6% more Chinese goods as previously, while US goods are now 6% more expensive to import to China. At this level, it works to boost Chinese exports and deter imports from other countries.
From an investor’s perspective, things look a bit different. Investors all over the world buy stocks, invest in companies, and do business in China, usually with their investments denominated in the Chinese Yuan. This means an investor from London converted his British Pounds to Yuan, and used that to buy stocks on the Shanghai Stock Exchange. From this investor’s perspective, when he eventually sells his shares, he will convert it back into Pounds.
When the exchange rate suddenly drops, it means that his investment is now worth less by exactly that amount; all of his investments in China would have just lost 6% of their value overnight. For the trillions of Dollars, Pounds, Euros, Yen, and Yuan invested from all over the world, this is a substancial loss.
This means that investors who lost value with the currency devaluation now are acting a lot more conservatively, pulling their money out of “risky” investments, and countries with less stable currencies, to try to find something more stable, like bonds. Currency traders are doing the same; trying to move all their assets out of riskier currencies. This is causing a domino effect; countries that were previously not involved, but which may have strong trading ties with China and so depend on exports to China (like Kazakhstan, which exports raw materials to China) are also getting hit both by investors pulling money out, fewer exports to China, and currency traders betting against them all at once. As more countries start to feel the sting, the panic begins to spiral outwards.
The market is still looking for a bottom, but until prices begin to stabilize, be ready for some volatility in your portfolio!