Bonds are essentially a much more formal I.O.U (I owe you) used to borrow money. You buy the bond in return to interest over a given period of time. When a corporation or government needs money they issue bonds that people buy. In turn, the issuer (the person who sells the bond) takes the money. However, no one would buy something if they didn’t get something in return, so the issuer will offer to not only pay the person back at a specified date but also provide some interest along the way.

There are two major types of bonds:

Government Bonds

These bonds are issued by governments who want to raise cash. It can be raised by any level of government; large cities often issue bonds to fund public projects, while national governments issue bonds to fund the government. When you hear about the National Debt of a country, it usually means the amount of bonds it has currently issued.

Government bonds can be traded by normal investors, but they can also be bought and sold between countries (if you hear a news pundit mention that the US government owes money to another country, like China, it is almost always because that country purchased a very large number of government bonds), or even between different parts of the government.

In the United States, the Federal Reserve buys and sells bonds from the US treasury bonds in order to influence the prevailing interest rates, for example.

Corporate Bonds

Corporations can also sell bonds, which is essentially borrowing money from a large pool of investors. Smaller companies can usually just take loans out from a bank, but if the company is very large (like Apple (AAPL), they use more cash than banks can usually give out in one single loan. Instead, they will issue bonds to investors, with a promise to pay back at a certain date with interest.

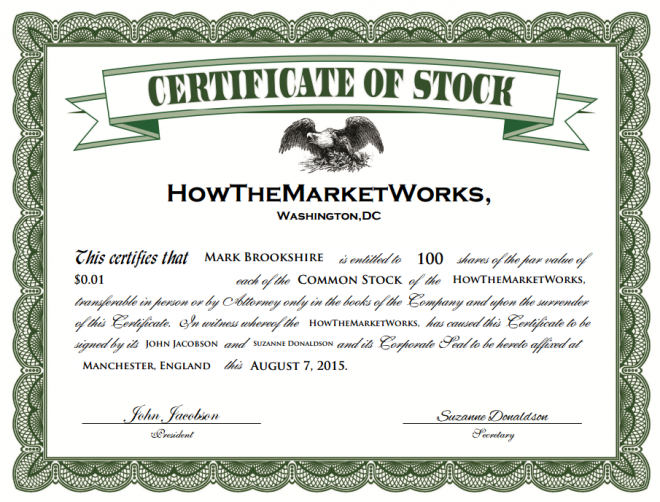
Bonds are one of two ways that companies frequently use to raise extra cash that they use for investment and expansion; the other is by issuing stocks. However, there are very important differences between the two:

  • If you buy a bond, you are lending money to a company and they are promising to pay you back later with interest
  • If you buy a stock, you are buying a part of that company and are entitled to part of its profits (in the form of dividends).
  • The value of the bond comes from how much you lent the company and the interest rate they will pay you back
  • The value of a stock comes from how much the company itself is worth (including all its assets and businesses)
  • Bonds expire; at the expiration date you receive back the amount you lent
  • Stocks do not expire

Details

Bonds can be bought and sold just like stocks, or they can be bought once and held to maturity at which point they will expire and return the face value. Essentially, when you buy a bond and hold it to maturity you will receive a certain predetermined interest rate (or coupon).

Remember that while a bond represents an amount of money that you lent to a government or company, they can still be bought or sold between investors like stocks. This means that you can buy a bond from Google (GOOG), but then later sell it to another investor who will then continue to collect the interest and receive the amount you initially lent Google when you bought the bond. Similarly, you can buy bonds from other investors rather than buying them directly from the company that issued them.

Investors typically will buy bonds when they are very risk averse, meaning they would rather have the guaranteed payment of regular interest than make riskier investments like stocks, whose value can rise and fall a lot over time.

Here a few terms that are important when looking at bonds:

Face Value

The face value, also known as par value or principal is the amount of money you will receive when the bond matures. This is almost always $1000 but there can be exceptions.

Coupon

This is the amount of interest you receive on your bond every year. It is usually stated in terms of the coupon rate (in percent). You then multiply your coupon rate by your face value, which in most cases will be $1000, to get your coupon. For example, if a bond is quoted at 4.00% you will receive $40 every year. Bonds can also be paid multiple times per year and are usually semi-annual (twice a year). In this case your coupon rate stays the same at 4.00% but you would receive two coupons of $20 instead of one coupon of $40.

Maturity

The maturity date is when the bond expires. If you are holding the bond on the maturity date then the bond Issuer will pay you the face value of the bond, which is almost always different from what you initially paid for it. In addition to the face value of the bond, if your bond had a coupon then you will also receive one final payment of whatever interest has accrued since the last payment was made. After this point the bond issuer’s debt to the bond holder is considered to be settled.

Yield

Since bonds are bought and sold between investors just like stocks, the value that they are bought and sold for on the market may not be exactly the same as the interest payments left until the bond expires and the face value. This is a very difficult concept to understand for many investors but is essentially the return you obtain when factoring the price you paid for your bond. The bond’s price is affected by the risk free rate and the bond’s own rate, as well as many other factors. The higher the Yield, the better the bond looks compared against other investments.

Accrued Interest

The interest payments on bonds are not paid daily; they are usually paid out once or twice a year (depending on the bond). However, the bond issuer owes whoever holds the bond interest for as long as they held it; if you only own a bond for a day, you are still entitled to one day of interest.

This is important for investors who buy and sell bonds a lot; if you own a bond that pays interest once per year on July 1st, but you sell it to someone else on June 15, you are entitled to most of the interest payment that they will receive from the bond issuer on July 1.

For example, lets say John bought a 5% 10 year semi-annual bond on the day it was issued and waits one year and 2 months before selling it to Kelly. This means John received two $25 coupons in the first year, and is entitled to another $8.33 from the bond issuer on top of the price he sold the bond for. This is because he held it for another two months hence 2/6 * $25 = $8.33.

Accrued Interest with Pricing

When looking at accrued interest, it has a huge impact on bond’s prices. Investors look at this in terms of a bonds dirty price and clean price. The dirty price is the price the bond trades for on the markets (if, for example, you bought a bond from another investor). This price does not subtract the accrued interest from the bond’s value. The clean price is the price with that accrued interest factored out.

Dirty Price = Clean Price + Accrued Interest

When you get a quote for a bond, you are almost always quoted the clean price, but when you buy it you will always pay the dirty price.

Rating

A rating is given to bonds to determine their level of riskiness. They are generally performed by third party auditing firms such as Standard and Poors, Moody’s or Fitch. Ratings system differ from company to company but it is important to know the difference between different bond ratings. The most common bond ratings are as follows:

  • AAA: Strongest Quality Rating, this has a very very low risk of default.
  • AA+ to AA-: Very high quality investment Grade.
  • A+ to BBB-: Medium quality investment grade.
  • BB+ to BB-: Low quality (non-investment grade) “junk bonds”, high risk of default.
  • CCC+ to C: Speculative bonds with very high risk of default.
  • D: Bonds in default for not paying principal and/or interest.
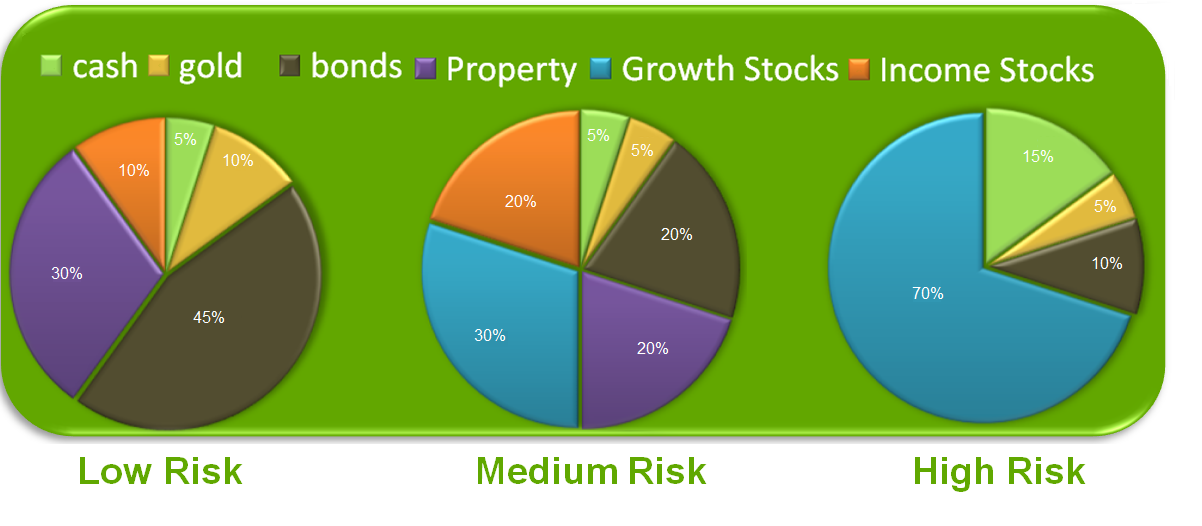
Portfolio

Nearly every balanced portfolio should have a place for bonds, if only for their strong safety while still beating inflation. Bonds can also be very risky, such as junk bonds (bonds issued by governments or companies that are very likely to not be able to pay back), that may pay high coupon rates but have a high risk of default. There are also many different types of bonds as well, such as convertible bonds that can be turned into stocks or inflation protected bonds that simply follow the rate of inflation.

Bond ETFs

You can also get exposure to bonds through bond ETF’s such as (BND) or (LQD). They have some notable differences between bonds with regards to tax considerations and returns but are much easier to trade.

Definition

Your “Risk Level” is how much risk you are willing to accept to get a certain level of reward; riskier stocks are both the ones that can lose the most or gain the most over time.

Risk

Understanding the level of risk you need and want is a very important part of selecting a good strategy. For nearly any strategy, whether it is picking stocks or doing asset allocation (picking how much of each type of investment we want) the steps in determining your level of risk are generally very similar. Determining the level of risk and reward needed is a key aspect of determining an investment strategy.

Determining your risk level

  • Time horizon: Your time horizon will involve when you expect to use the money you are investing.

    For example, a 25 year old who is saving for retirement can go for much riskier investments since if he loses his money in a bear market, he still has a few decades to be able to make his money back. Choosing safe investments for a 25 year old would also not be a good idea since he would be losing out on the opportunity to make a lot more money. On the other hand, someone who is retiring next year will not want to risk losing his or her money if a market collapse occurs right when they retire. They would have no time to recuperate the money and could be in serious trouble, so they will want very low risk investments.

    Hence, the longer your time horizon, the higher risk you can afford. The shorter the time horizon the lower risk you should choose.

  • liquidity: This aspect is very similar to the time horizon. Essentially someone would not choose an illiquid asset if they had needed the money for that investment in the next month. For example, real estate is considered fairly illiquid as it can take months to years to get a good price on your investment. On the other hand, popular stocks are considered very liquid as they can usually be sold anytime during market hours.
  • Investment knowledge: The higher your investment knowledge, the riskier the investments you can take. The reason being that you are more aware of the inherit risks and therefore more likely to make informed decisions. You would not expect someone with no investment knowledge to jump right into currency trading, they would most likely start off with mutual funds or bonds.

    For example, a wall street trader will not consider futures to be as risky as someone who has never even traded a stock. The trader will know how to protect himself and have a better idea of the risks involved. It is essentially the old adage “That knowledge is Power” at work, but in this case, Knowledge is Reduced Risk.

  • Risk aversion: This is a measure of how comfortable you are with risk. The opposite of risk aversion is risk seeking. The level of risk aversion is usually determined by considering different scenarios and picking the one that one feels most comfortable with.

    High risk aversion: You would prefer to invest in a stock that could have gains of 20% but has only lost 5% at most at a time.

    Moderate risk aversion: You would prefer to invest in a stock that could have gains of 70% but also loses 20% on a regular basis.

    Low risk aversion (risk seeking): You would prefer to invest in a stock that could have gains of 200% but also loses 100% on a regular basis.

  • Economic outlook: Unless you are following a very specific contrarian strategy, the worst the economic outlook is, the lower we would want our risk. On the other hand, a great economic outlook would allow us to increase our risk.
  • Savings and income: This can have a large bearing on the type of investments you will make. Someone with large amounts of savings but very little income will invest very differently from someone with a lot of income and very little savings. Again, this comes down to your individual goals. In general we would establish with our time horizon whether what our objective is. Whether we are trying to save or have income every year.
  • Tax Considerations: Tax considerations are a very complex matter given the large amount of differences in taxes between countries and even within. Tax breaks and savings should not be your main focus at the detriment of picking sound investments. However, it is very important to take advantage of tax breaks whenever possible when investing. Furthermore, there are usually differences between capital gains (for example a growth stock) and dividend gains (dividend stocks) which can make one or the other far more or less attractive than the other. Every location is different so it is important to educate yourself on the taxes associated with each asset.

To summarize, if investor XYZ wanted to know what his level of risk should be for his Investment strategy, he would go through each category and sum up his risk. For example, if XYZ needed his money in ten years, has moderate risk aversion, has very little investment knowledge and there is poor economic outlook. We could say his risk should be somewhere in between low and moderate.

The risk pyramid

Now that you’ve got a better idea of your risk level we can look at the types of investments that are right for that level of risk.

riskpyramid

Note: You can mix a high risk asset with a low risk asset to get a similar asset of moderate risk. However, this is not always the case and is often difficult to assess exactly the level of risk, especially for high risk assets. It’s therefore much better to get a moderate risk asset if you want a moderate risk. If you are looking at this in the context of a portfolio you should also look at Asset Allocation.

Creating a Diversified Asset Allocated Portfolio

Here are a few guidelines when trying to create your portfolio:

  • Cash: Keep enough cash on hand for daily purchases and small emergencies. It can be wise to keep enough money in your bank account to avoid the fees.
  • Gold: Many investors keep a small amount of physical gold and cash on hand. This can be useful in financial crises like the great depression where limits are imposed on the amount of money that can be withdrawn. Gold is also extremely safe and not tied to a countries currency.
  • Property: Your house is an investment as it has value and should be considered as such.
  • Bonds: They are generally not good investments unless you are trying to protect what you already have. This was not always true however and is dependent on the interest rates.
  • Stocks: Diversification of stocks is important and generally the cheapest way to do is with mutual funds or exchange traded funds (ETF). Growth Stocks are generally considered to be riskier than income stocks.

Examples

Here are examples of asset classes we might assign to each investor. Note: Asset allocation is not an exact science and can have big differences between one opinion and the next.

Low Risk Portfolio: Retiree with high investment knowledge, very low income and moderate risk aversion.
Moderate Risk Portfolio: Middle aged investor with low income, high investment knowledge and moderate risk aversion with large savings.
High Risk Portfolio: Young investor with good income and high investment knowledge and low risk aversion and high spending with no owned property.

assetallocation

Berkshire Hathaway and 3G capital took control of Kraft foods and Heinz ketchup not long ago, where efforts first focused on Heinz.

After replacing most of the top-level management (and many of the juniors), Heinz also shaved thousands of jobs in an effort to cut costs. The efforts seem to have worked; it boasted some of the best margins in the food industry after the cuts were implemented.

Hathaway and 3G are now turning their sights on Kraft, and hoping many of the same policies will work. In addition to job cuts and management replacement, they will be moving the corporate headquarters from the Suburbs to downtown Chicago, placing strict limits on travel and food expenses, and even removing free snack refridgerators from staff break rooms. Employees will also no longer be allowed to bring competetor products to the office for lunch, as it “voliates the respect for the food we make”, among other restrictions.

Only time will tell if the belt-tightening will pay off!

Read More on Bloomberg

Everyone paying attention to the news lately knows that there has been a lot of rough water over the last month or so; Gold and Oil have been tanking farther than usual, the Chinese currency devaluation rocked global markets while the Chinese stock market plummetted.

Which is, coincidentally, a great time to start looking at what to buy. For investors that have been sitting on the sidelines, the classic adage “buy low, sell high” is becoming more true than ever; when markets have bottomed out is the best time to start scooping up cheap assets. These assets are now cheap for a reason; the risk associated with them, but investment firms playing the “long game”, looking out 3 or more years into the future, are starting to see opportunity. Stocks like Micron Technology (MU) have lost more than half their value, but their actual business case is not worth half what it was a year ago.

For the long-sighted investor, this might be a time of great opportunity!


Read more on Yahoo! Finance

Definition:

An asset is anything that has monetary value and can be sold. Assets can be anything from a pencil (though it is not worth much) to a skyscraper to things like Stocks and ETFs.

There can also be intangible assets such as the value of a brand name or logo.

Details:

Assets generally refer to either something that you intend to sell later for a profit, or something you are actively using to make money. This means that assets generally fall into two categories, Investments and Capital. The easiest way to tell them apart is this:

  • If you are using it to build something or make something (like a computer or a factory machine) that you later sell, it would be capital
  • If the value of the asset is the asset itself (like stock, bonds, or gold), it would be an investment

There are also some things that fall in the middle: For example, your house is considered an “investment” even though you are using it to live in, because hopefully it can one day be sold for a profit, with that profit being likely used for retirement.

Examples:

Here is a short list of typical assets:

Cash: Cash, marketable securities, coins.
Precious Metals: Gold, silver, platinum.
Investments: Stocks, bonds, options, pensions, mutual funds.
Property: Land, commercial buildings, houses.
Machinery: Factory machines, cars, trucks, forklifts, washing machines.
Intangible assets: Trademarks, brand value.
Objects: Inventory, books, anything that has value.

Note: Typically when asset is mentioned in a financial context, it usually refers to real estate, precious metals, investments such as stocks and bonds, cash and other financial devices.

There are also many more types of asset than this

Definition

“Asset Allocation” is how you have divided up your investments across different assets. You can have all your assets in one place, or you can use diversification to spread them around to reduce risk.

Details

Whenever you pick stocks, open a bank account, get paid, buy something, or do anything with any resources, you are doing some form of “Asset Allocation”. Early on, the choice is simply “Spend” or “Save”, how you are using your money. But like most things with investment, it is never that simple.

For example, once you have chosen to “spend” or “save” a dollar, you have another choice to make:

  • If I spend it, do I buy a video game or go out to the movies?
  • If I save, do I put it in a savings account or hold it as cash?

For us, we care mostly about savings. So if you save $1000, you can save it as cash, put it in a savings account, or invest it.

  • If you put it in a savings account, there are different kinds of savings accounts that may give you a higher interest rate, but limit how much you can withdraw.
  • If you invest it, you can divide your investment between stocks, bonds, mutual funds, or ETFs
    • If you invest in any stock, bond, mutual fund, or ETF, you will need to decide which specific ones to invest in

Of course, at every level you also have a choice of splitting your money and doing one thing with part, and something else with another. With your $1000, you can spend $300, hold $100 as cash, put $200 in a savings account, use $150 to buy Johnson and Johnson (JNJ) stocks, and invest the last $250 in mutual funds. That is a lot of choices to make, even with one small block of assets!

Choosing How To Allocate Your Assets

Every time you allocate your assets, you are making many choices at once

When Spending

When you spend your assets, your main decision is Opportunity Cost. If you spend your money on one thing, you cannot spend it on another, so you need to make sure you are buying whatever it is that will give you the most benefit. You are also choosing not to save or invest, which means the benefit you get from buying something today should outweigh the benefit of having that extra investment return in the future.

When Investing

When you invest, your asset allocation will be based on 4 main criteria:

  1. Risk: Sometimes taking bigger risks can give bigger rewards, but you still have the chance of losing big too. How much risk you can tolerate will dictate a lot of your asset allocation.
  2. Liquidity: How much do you want the freedom to move your money? Assets that you can quickly convert back to cash are said to be very “liquid”, while assets that are very difficult to convert to cash (like houses) are “illiquid”. How much you value being able to move your asset allocation over time will also dictate what kinds of things you invest in
  3. How much you have: You can only buy a house if you have the ability to pay for it, and that goes with most other investments as well. If you do not have the assets necessary for a minimum investment, some options may be not open to you. This is becoming less and less of an issue with stocks, bonds, mutual funds, and ETFs, however.
  4. Opportunity Cost: This is the same as with Spending; whatever you invest in one asset is money you cannot use to buy something or invest in something else.

When you balance these four criteria, you will start coming up with your asset allocation. Just because you value one more than the others does not mean all your assets will go to one place either; a person who values liquidity the most probably will not keep all their assets as cash, both because it is risky (cash can be easily lost or stolen), but also because there is only so much cash you need at one time, so you can hold lots of cash but still keep some invested.

Asset allocation is the basis for risk management, building a portfolio, and diversification


New data shows that housing starts hit an 8-year high in July, with a construction frenzy underway as the housing market continues on its recovery after the financial crash.

Home remodeling activity has been up as well, which helped Home Depot (HD.N) beat earnings estimates and see stock prices reach new heights. There have been other spill-over effects as well; the construction boom has helped lower the unemployment rate as construction firms increase hiring to meet demand, and all this building has driven the need for new trucks, new tools, and other light and medium industrial goods from companies like General Motors (GM) and Ford (F).

There may be some dark clouds on the horizon however; the number of new building permits, which usually signals construction that is to begin fairly soon, hit a sharp decline. This may be partially due to the end of the summer, but the numbers are down even when seasonally-adjusting.


Read More on Yahoo! Finance

The world markets are still edgy after China’s currency devaluation last week, and a Fed report showing that New York area manufacturing started sliding downwards has not put any investors at ease.

Commodities and stocks both started down on Monday morning, many top analysts predict the pullback will continue for a short while longer as investors “feel out” what all the fallout from these big events will be. The fall in manufacturing is not especially unexpected, but as bad news piles up it makes investors start looking for safe havens for their money.

Traditionally, there have been two “havens” to go; bonds and gold. Gold, however, continues to decline along with many other commodities (especially oil) in a long-term downward trend. This leaves bonds, which have seen demand spike, and thus yields plummet, over the last few days as investors pour money in. It would not take much to have the market start swinging the other way, so pay close attention to the current market news to know where market sentiment is heading!


Read More on Bloomberg

StockLinkU, the stock simulation site launched in 2012 from Greenville SC, has apparently shut down.

StockLinkU has apparently closed its virtual trading site. The site has been unavailable for several months now and there are no comments from its facebook and linkedin pages. Launched in 2012 as a free site, the site struggled to gain an audience or establish a niche. StockLinkU was originally a free site, then changed its model to a pay site, and now has apparently disappeared and gone under.

Former StockLinkU users are encouraged to explore the other leading stock simulation and virtual trading sites:

  • StockTrak Global Portfolio Simulations: Stock-Trak, now in its 25 year, is without a doubt the leading virtual trading site for university Investments, Portfolio Simulation, Derivatives, and Personal Finance classes. StockTrak allows professors to create a custom virtual trading contest for their class by selecting the trading dates, initial cash balance, and other parameters. Students then register into that contest and compete against their fellow classmates trading stocks, bonds, mutual funds, options, futures, and forex from over 50 global exchanges.
  • HowTheMarketWorks.com: HowTheMarketWorks, launched in 2004, is a FREE alternative, similar to StockTrak, except students are only allowed to trade U.S. stocks, mutual funds, and ETFs. HowTheMarketWorks was used by over 350,000 users and in 10,000 classes and clubs in the last 12 months.

If you are looking for an alternative to StockLinkU, either of these sites will work and they will be around many years from now.

The European Union economy was expected to grow by about 0.4% in the 2nd quarter of this year, but researches have determined it missed the mark, coming up only at 0.3%.

This may not sound like a big miss, but that tenth of a percent is a lot of money (billions of Euros of unrealized growth) that has many investors worried. The main reason for the miss was a slowing in the 3 biggest economies: France, Germany, and Italy.

France in particular was estimated to grow by 0.2%, but actually just broke even; Germany expected 0.5% and came in only at 0.4%.

The union has been rocked by the Greek debt crisis; while Greece accounts for only a very small percentage of the entire Euro area’s economy, the gloomy news has been dominating the headlines and dragging down investor confidence. In fact, Greece has expanded more than analysts had hoped, but researches have yet to find a way to figure in the capital controls in July into their results, and the Greek stock crash is sure to weigh down results for the next quarter.


Read more on Bloomberg

The beginning of the week was dominated by the Chinese currency devaluation; the Chinese central bank devalued the Yuan by over 4% from Monday’s exchange rate with the US dollar over the week. However, by this morning, things have returned more-or-less to “normal” on international currency markets.

The biggest fear when the devaluation was announced was the possibility of a “currency war”; where countries try to repeatedly de-value their currencies against each other to help boost exports their own exports. One of the immediate results from a threat of a currency war is that investors try to “flee” volatile assets like stocks to “haven” securities like bonds and gold. This makes the demand for stocks fall (and so stock prices tend to do down), while the demand for gold and bonds goes up (and the prices with it).

Thursday saw calmer markets as fewer investors were fearing a currency war; bond and gold prices dropped back to previous levels and stock prices also began their recovery.


Read More on Bloomberg

An investment strategy is the set of rules and behaviors that you can adopt to reach your financial and investing goals. Choosing an investing strategy can be a daunting task when you are starting to learn about investments and finance. Here we will look at the larger overall strategies rather than very specific strategies.

Given that this is such a broad term there can be strategies that go from the top (Overall Portfolio Strategies) to the bottom (stock-picking strategies). You can decide on a strategy starting with an overall strategy and then select more specific strategies (top – down approach) or similarly you can look at a specific strategy and select the overall strategy that goes with (bottom – up approach).

What’s important to note is that a strategy can incorporate multiple strategies, practices and tools. Doing one strategy does not always mean that another strategy cannot be used in conjunction. What’s most important is finding your own strategy and familiarizing yourself with all the different strategies and financial tools that are available so that you can make a decision that is well suited for you.

Picking a Strategy

Strategies

Given the huge number of strategies and variations within strategies we are only going to review common strategies. The level of risk for most is highly dependent on the type of investments made, rather than the strategy itself. The most popular strategy that is used by most investors that would go to a bank or an investment firm, for example, is a mix of diversification and asset allocation.

Random picks: Picking a large amount of random stocks has been found, on average, to be more successful than the vast majority of trading strategies.

Follow: Involves following whatever stock is “hot” at the time.

Buy and hold: Involves simply buying stocks and holding them for a longer period of time.

Day trading: Considered to be fairly risky trading strategy of buy and selling many times in one day to take advantage of fluctuations in the market.

Contrarian: Involves doing the opposite of the current market sentiment. Buying when everyone is selling and selling when everyone is buying.

Cyclic: Involves trying to time market ups and downs and trading accordingly, usually done with technical analysis.

Technical: Using Technical analysis to make decisions.

Fundamental: Using Fundamental analysis to make decisions.

Income: Finding assets that give income on a regular basis (such as dividends)

Growth: Finding assets that will have high potential growth but little current income.

Diversification: Choosing a large number of stocks or assets to reduce risk.

Asset Allocation: More of a guideline than a strategy, that can help with determining the correct amount of investment in each asset type.

As we’ve seen, even a buy and hold strategy can be incredibly complex depending on the specific strategy you use and the level of analysis made. What’s important is to tailor your strategy with what you are trying to accomplish. Someone who needs money right away but is risk seeking and has a great deal of knowledge may consider day trading to be a very viable option. Similarly, someone who has decades to invest and moderate risk aversion may still want to try his hand at day trading.

Passive Vs Active

Overall Strategies can also be broken up into passive and active categories:

Passive strategies are just that, passive. After making the initial decision to purchase a stock, investment, etc. the passive investor will keep it for months or years without making large changes. An example of this is someone like warren buffet who generally holds stocks for long periods of times and does not make changes to his holdings very often.

The active trader, however, will trade multiple times a week or even per day and will constantly evaluate what he is doing. Day traders are the most obvious example of an active trader.

It’s important to note that passive and active trading is over a spectrum, so someone who makes a few adjustments to their portfolio a few times a week could still be considered passive depending on the size of his portfolio for example.

Liquidity, Risk, and Potential Returns

All investments balance liquidity, risk, and potential returns. The balance among these three areas depends on your own individual taste, but how you view them will determine what kinds of investments you choose. 

  1. Liquidity: Liquidity refers to how easily and quickly an asset can be converted into cash without losing its value. High liquidity means that the asset can be sold quickly at a fair price, whereas assets with low liquidity might take longer to sell or might require a discount to attract buyers.
  2. Risk: In the context of investments, risk refers to the degree of uncertainty about the possible outcome. High-risk investments have a greater chance of losing money, but they may also offer higher potential returns. Low-risk investments are generally more stable and reliable, but they tend to offer lower returns.
  3. Potential returns: Potential returns are the possible profits or gains an investor could earn from an investment. Investments with higher potential returns are usually associated with greater risk, as there’s more uncertainty about whether the investment will actually result in a profit. Conversely, investments with lower potential returns are typically less risky but also have limited profit potential.

Don’t Keep All Your Eggs in One Basket

Diversifying your investments is crucial at various levels, not just between asset classes, but also across sectors. Start by allocating your assets among different security types. For instance, a classic approach involves investing 50% of your savings in real estate, while the remaining 50% is divided between stocks and bonds. This way, if housing prices decline, your investments in stocks and bonds can provide some protection. Similarly, if the stock market falls, your real estate and bonds could help stabilize your portfolio.

Bonds are generally safer investments since their value is tied to prevailing interest rates, making them less susceptible to market fluctuations. They can also be beneficial during a rise in housing prices, stock prices, and interest rates, further reinforcing the importance of diversification.

Use an Evolving Portfolio

The traditional advice to invest in “more bonds as you get older” stems from the belief that your portfolio should become more conservative as you approach retirement. The idea is to minimize risk with your money as you near retirement age. If your stocks lose value when you’re 25, you have around 40 years to recover the losses before retiring. However, if your stocks decline in value when you’re 62, it’s much more challenging to compensate for the lost income, emphasizing the need for a lower-risk investment strategy in later years.

Alibaba (BABA) missed its earning target, driving shares farther down for the company that had the world’s largest IPO last year.

The news of the Chinese commerce behemoth’s miss came just after China announced another round of currency devaluation, bringing the total drop of the Yuan to almost 4% compared to last week against the US dollar.

Alibaba stock has been on a roller coaster since inception, the tumble after this earnings announcement brings it down to just 40% of its all-time high. Managment has been unfazed, however, with the CEO Daniel Zhang commenting, “We had a strong quarter and we continued to build the foundations for future growth. We focused our efforts on building healthy GMV growth, delivering the best consumer experience, and improving the quality and sustainability of merchants doing business on our marketplaces. “We are excited about our top strategic priorities, including internationalization, winning in mobile, expanding our ecosystem from cities to villages, and investing in core technologies that will propel our cloud computing business.”

The earnings miss was not all bad news, so his upbeat tone is not unwarrented; its revenue was $3.16 billion versus an expected 3.28, and business great at 34%, which is the slowest of the last few years but not too shabby by any metric.


Read More on Yahoo! Finance

Tuesday morning China announced an immediate 1.9% devaluation of the Yuan, surpising investors and economists around the world. Bankers around the world have long criticized China for manipulating its currency value in order to help drive exports; this sudden devaluation only strengthens those concerns.

The Chinese economy has been facing slowed growth over the last few months, which has been exaserbated by signs that the Chinese stock bubble is finally bursting, with huge losses across the board.

The reason that the devaulation is a bid deal is because China historically has set the exchange rates between the Yuan and other major currencies, dictating how much their currency is “worth”. If a single US dollar can buy 2% more Chinese Yuan today than it could yesterday, it means that Chinese exports just got 2% “Cheaper” to everyone else in the world, and at the same time imports become more expenses.

Analysts believe the Chinese central bankers are using this to their advantage; by making exports cheaper they hope to continue to drive industrial output destined for other countries, while making imports more expensive would help increase domestic domand for Chinese-made goods by making imported substitutes less attractive.


Read More on Yahoo! Finance

Definition

Volume-Weighted Average Price (VWAP) is often used as a trading benchmark by traders, pension funds, mutual funds and market makers. It can allow traders to get a sense of how successful they were in obtaining a good price. A buy order filled below the VWAP would be considered a good trade.

Using VWAP

A lot of people will wonder why not just use the average price, it’s a lot easier to calculate and isn’t it essentially the same thing anyway? As we can see, the difference is that it tracks volume as well. By tracking volume you also get information about liquidity as well as the amount of money that traded, not just the price.

Calculation

VWAP calculation can vary greatly depending on the time frame and time horizon you choose, as well as the price calculation. However, VWAP is typically used within one trading day and uses a one minute time frame.

The formula for VWAP is:

VWAPformula

The price can be used as the last price in a time frame or the price calculated using the high, low and close in a given time frame. Here is an example of the calculations:

VolumePricePrice * VolTimeVWAP 1 min
2010.1510.15*20 = 2039:30203/20=10.150
3010.2110.21*30 = 306.39:31(203+306.3)/(20+30)=10.186
7510.2275*10.22 = 766.59:32(203+306.3+766.5)/(20+30+75)=10.206

We can see from the calculations that the VWAP is cumulative and thus a price at the beginning with high volume will have more effect than a price at the end of the day, since it is now just a drop in all the trades placed over the day. It would take a very large volume and/or price change to change the VWAP at the end of the day (depending on the time frame you use). Another important thing to notice is the time frame, a smaller time frame (such as every trade or tick) will be more accurate, but for a stock that trades a lot this could be data for 50,000 trades. If you are doing multiple stocks, this could easily slow down or even crash your computer if you started storing and calculating enough days.

Graph

The greatest change in the results and calculation of VWAP is the time frame. If we look at the difference below between a 1 minute time frame and a two minute minute time frame we will see there is a discrepancy.

VWAPgraph

As we can see the two minute does not follow as closely as the 1 minute since it is only “checking” the price every two minutes.

Another ratio we can use similar to VWAP is the moving VWAP (MVWAP) that is similar to a simple moving average. This will use a different period and will sometimes be carried over from day to day depending on the period used. Essentially, instead of starting at one day, we will calculate our MVWAP using the data over the period we wish to study. For example, we can say we wish to take a period of 10 minutes and thus we will essentially have a VWAP that started it’s “day” ten minutes before.

Oil Futures are down again this Monday morning after the newest reports show that the US has deployed 6 more drilling platforms, while OPEC continues record output.

Countries who rely on oil exports for a significant amount of tax revenue have been pummelled; Canada is struggling to keep its promise of a balanced budget, Norway is calling $50 “Worse than the global financial crisis“, Russia is slashing social programs to make up the shortfall, and OPEC countries have been burning through cash reseserves at a record rate.

However, even with all the doom and gloom, no one is looking to start cutting back supply, even as global demand looks to be weakening with the end of the Summer. OPEC is scheduled to meet in December, but many members are already pushing for an earlier meeting to discuss pulling back to raise prices.

The United States is also not immune; oil producers make up a large share of the energy sector, which historically has been one of several pillars retirement accounts have rested on. Weakening oil could mean bad news for millions of pensioners, depending on how nimble their money managers have been at addressing the price collapse.

Read More on Yahoo! Finance

Based on the latest reports from the US Department of Labor, over 215,000 jobs were added in July, following a 230,000 increase in June. Despite the gloom-and-doom in the commodities market (especially oil and gold), hiring across the entire economy has been growing at a fairly stable pace over the last 5 years as the overall economy continues to grow.

The continued strong hiring numbers indicates that companies expect the growth to continue; companies only hire more workers when they estimate continued increases in demand, and the bright future outlook is good both for companies and workers looking to earn more.payroll employment

The increase in payroll employment was not matched with a decrease in unemployment, however (the unemployment rate remains at 5.3%, unchanged from June). This can mean one of two things: either people who were previously not looking for a job have now started looking because they think prospects are better, or people who were already working part-time or for very low wages have “upsold” into better jobs with higher salaries. Either way, it is good news for the average American worker.


Source: Bureau of Labor Statistics


This is the biggest new feature we’ve ever added!

We know that there are tens of thousands of teachers who use HowTheMarketWorks in their classroom every year to teach math, social studies, personal finance, and business, so we’ve added some great new features just for you. We call them “Assignments“, and they will make teaching about the stock market a breeze!

Here’s how it works: After you create your class contest, click on “Manage Assignments”. This will let you create a new assignment, delete an assignment you’ve already created, or see the progress of all your students on assignments that are already in place.

Assignments are a group of tasks that appear for everyone in your class contest. These include tutorials to help get started, like watching our tutorial videos, placing different types of trades, reading some of our articles for beginners, and using our personal finance calculators to solve a series of challenges.

The current beginners articles you can include are:

The current calculators you can choose from are:

At the end of each article or calculator, there will be a short (3 to 5 question) quiz on the content of the article or questions that can be solved using the calculator. Once your student can get all the questions right, their assignment will be marked as “Complete”! Students can re-take the quizzes as often as they like until they get full credit.

Your students will also have a progress bar on their Open Positions page showing their current assignment progress, along with the next list of tasks they need to complete. When we did a demo of the assignments for some teachers, we can already tell it will be a hit, so check it out today!

Click Here for more details on how to use Assignments with your contest.

As always, there have been tons of smaller changes and bug fixes every week.


In a game of Tit-For-Tat, Russia banned imports of most food from Western Europe last year after Europe imposed sanctions on Russia for the invasion of Crimea.

However, distributors from Eastern European countries, particularly Belarus, have been trying to circumvent the ban, smuggling or re-packaging Belgian, French, and German food and shipping it to waiting buyers in Russia. The Russian government has not been pleased; thousands of tons of food have been confiscated and are being destroyed as part of the ban.

A petition with over 250,000 signatures has been circulating Moscow as people ask the food instead be donated to the poor, but the pleas have so far fallen on deaf ears.

Russian farmers have been generally happy with the ban; the vacuum left by foreign competition has been causing food prices to spike, and farmers are making much more for the same corps they produced before. The Russian Government has been focusing strongly on this “silver lining” that it may eventually push Russia along to self-sufficiency for food production.

The flip side, which the government has been largely ignoring, is that this spike in food prices is cripping the incomes of millions of people around the country. Over half the household budget of the average Russian family is spent on food, and this spike in prices is driving millions of people back under the poverty line.

Read More on Yahoo! Finance