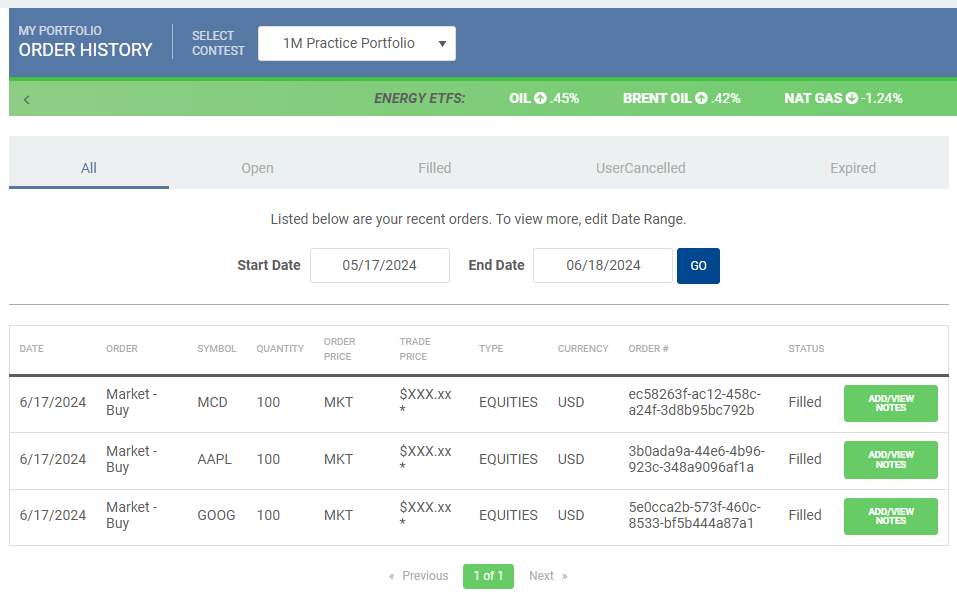
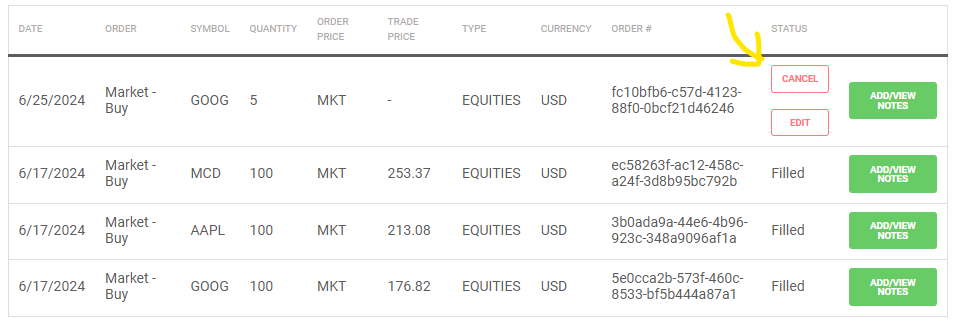
Stock Market Game Questions And Answers

We get tons of questions about our stock market game, so this is where you can find the answers!

If you have technical questions, like how to make a trade or create a contest, check out our virtual trading FAQ. This covers the basics of the basics, and where you can look for more beginners investing information. You can also click here for a list of glossary terms with in-depth explanations, or look in to our Beginners Investing Course to get everything you need to know to start investing on your own in one neat package.

What is a stock?

A stock, at the most basic level, is a piece of a company that you can buy. For more information on the basics, click here.

What is a mutual fund?

A mutual fund is a collection of stocks, bonds, currencies, and other securities that are collected into a large, ‘mutual’ portfolio that you can buy in to. To learn more about mutual funds, click here.

What is an ETF?

An ETF is like a mutual fund, but trades on an exchange like a stock. It usually follows a major index, like the S&P 500. To learn more about ETFs, click here.

What is an Index?

An index is a benchmark that is used to measure the market as a whole, or one particular industry. An index is made up of a collection of stocks. For more information, click here to read about the Dow Jones Industrial Average, or click here to read about the S&P 500.

What are the NASDAQ and NYSE?

These are “stock exchanges”, or places were stocks are listed for the public to buy and sell.

What are Bid and Ask prices?

When you want to buy or sell a stock, there is not one giant body that will buy or sell at a given price; there are millions of other people that are also looking to buy and sell, and an agreement must be reached. The “bid” and “ask” prices are the differences between the people who currently want to buy “bidders” and people who want to sell “askers”. For more information on bid and ask prices, click here.

What do I need to get started investing on my own?

Very little, you could start today if you wanted! Discount brokerages will open trading accounts with very little initial investment that you can use to buy and sell stocks as you wish, usually charging $5-$10 in commission. However, it is always a good idea to practice before you risk your investment, so we recommend using our free paper trading game to try investing fake money in real US and Canadian stocks and mutual funds before entering the market.

Our Virtual Stock Exchange allows you to practice buying and selling real stocks using our online trading game for the purpose of gaining experience with stock trading. This is also known as paper trading or fantasy trading.

You can start trading right away on our free Virtual Stock Exchange. Register now!

Need more information? Visit our Virtual Stock Market Trading FAQ for instructions!

Virtual Stock Market Features

Here just a few of the great features we have absolutely free:

  • Practice building a portfolio with real stocks, mutual funds, and ETFs, and follow its progress with real-time prices!
  • Practice Day-Trading, with your choice of commission structure to simulate any brokerage you want!
  • Trade all US stocks, ETFs, Mutual Funds!
  • Trade all Canadian Stocks and ETFs!
  • Stock Charts and Quotes!
  • Real volume rules to see what it is like trading in the world!
  • Real-Time Bid/Ask prices!
  • Ability To Track Your Portfolio As Long As You Want!
  • Analyst Ratings And Recommendations From Professionals!
  • Public Contests, Some With Cash Prizes!
  • Create Your Own Custom Contest!

Sign up for a New Account today!

See our Virtual Trading FAQ for more answers!

Happy Trading!

Click Here to see all Beginner Stock Trading Articles

Is this system free?
Yes, this site is completely free! We are supported by advertising.

How do I sign up?
Click on “Create Account“. Fill out the registration page and then sign in with your password. If you need help, check out our tutorial video on how to sign up and make your first trade:

I forgot my password. What do I do?
At the top of the page, click Forgot Password, then enter your username or email address and we will send you password reset instructions.

Do you allow limit orders and trailing stops?
Yes, we fully support limit orders and trailing stops! If you want to see what these order types are, and how to use them, watch our great tutorial video:

How long can I use my account?
You may use your account for as long as you like! However, if you do not log in at least every 6 months we may delete your account in case someone else would like to use that username.

How do I change my cash level?
If you want to change the starting cash in your practice portfolio (outside of a contest) after registration, please Contact Support. However, if you create your own custom contest, you can create an additional portfolio with any cash balance, in any currency, that you would like.

How do I reset my account?
For your practice portfolio, and any contest portfolio where resets are allowed, there will be a link to reset your portfolio at the top of your “My Portfolio” page.

Does the system use real stock quotes?
Yes, all of the quotes are real. Some are real-time and some are delayed 15-20 minutes.

Is there any real cash involved?
No, it only uses virtual cash and there are no cash prizes if you do well.

What time are the markets open?
The markets are normally open 9:30am-4pm Eastern time Monday-Friday, except on market holidays.

Can I trade after the market closes?
You can place orders after the market closes, but they will not execute until 9:30 in the morning on the next business day (when the market opens).

Do you allow Short Selling?
Yes! If you want to see how Short Selling works, and see how to do it in our system, you can check out our Short Selling tutorial video:

How many portfolios can I have?
You may have as many portfolios as you like! Just create or join another contest to add an extra portfolio.

Do you have a special section for students and teachers?
No, but we plan on adding that later this year.

How do I change my password?
Click on your username at the top of the screen to open the Profile page. Here you can change your password, add details to your account, and even upload an avatar.

How do I log out?
Click on Log Out on the upper right section of any page.

What if my stock changes symbols?
We will update your stock’s symbol automatically within a couple days of the change.

Does my account accrue interest?
Yes, the interest rate set to 3% paid on cash balances. This can be changed on custom contests by clicking “Edit Contest” on the “My Contests” page.

How does this system handle dividends?
We post dividends every morning for the most commonly traded stocks. However, it is possible we miss some, so if you think you should have been paid one and we missed it, Contact Us with a news article stating the symbol and amount of the dividend.

Can I practice trading on margin?
Yes, our system now allows margin trading! Whether or not you can trade on margin is how decided in the Contest Creation rules, so ask your contest creator if it is allowed or not. Margin trading is enabled in your practice portfolio.

How close to real trading is your virtual stock exchange?
It is very similar but there are some important differences. For example, we pay interest on cash you hold in your account at a 3% interest rate, which is probably not the interest you would get in a savings account at any given year. However, since we fill all orders at the real-time bid ask prices (for US stocks), the actual trading mechanics are very similar to trading in the real world.

Where can we get some good trading ideas?
Our favorite source of up-to-date stock recommendations from major newsletters, brokerages and analysts can be found a this best stocks to buy now page.

Try our free stock market game  today!

Click Here to see all Beginner Stock Trading Articles

This is a list of the top stocks and stock charts in the HTMW stock exchange game, based on the S&P 500.

Jump To Stock by Clicking Letter
A B C D E F G H I J K L M N O P Q R S T U V W X Y Z

Rank Quote Chart
1 3M Company MMM
2 Abbott Labs ABT
3 Abercrombie & Fitch Co ANF
4 ACE Limited ACE
5 ADC Telecommunications ADCT
6 Adobe Systems ADBE
7 Advanced Micro Devices AMD
8 AES Corp. AES
9 Aetna Inc. AET
10 Affiliated Computer ACS
11 AFLAC Inc. AFL
12 Agilent Technologies A
13 Air Products & Chemicals APD
14 Alcoa Inc AA
15 Allegheny Energy AYE
16 Allegheny Technologies Inc ATI
17 Allergan Inc. AGN
18 Allied Waste Industries AW
19 Allstate Corp. ALL
20 ALLTEL Corp. ATI
21 Altera Corp. ALTR
22 Altria Group Inc. MO
23 Amazon Corp. AMZN
24 Ambac Financial Group ABK
25 Ameren Corporation AEE
26 American Electric Power AEP
27 American Express AXP
28 American Int’l. Group AIG
29 American Standard ASD
30 Ameriprise Financial Inc. AMP
31 Amerisource Bergen Corp. ABC
32 Amgen AMGN
33 Anadarko Petroleum APC
34 Analog Devices ADI
35 Anheuser-Busch BUD
36 Aon Corp. AOC
37 Apache Corp. APA
38 Apartment Investment & Mgmt’A’ AIV
39 Apollo Group APOL
40 Apple Inc. AAPL
41 Applera Corp-Applied Biosystems Group ABI
42 Applied Materials AMAT
43 Archer-Daniels-Midland ADM
44 Archstone-Smith Trust ASN
45 Ashland Inc. ASH
46 Assurant Inc AIZ
47 AT&T Inc. T
48 Autodesk Inc. ADSK
49 Automatic Data Processing Inc. ADP
50 AutoZone Inc. AZO
51 Avalon Bay Communities AVB
52 Avaya Inc. AV
53 Avery Dennison Corp. AVY
54
Avon Products AVP
55 Baker Hughes BHI
56 Ball Corp. BLL
57 Bank of America Corp. BAC
58 Bank of New York BK
59 Bard (C.R.) Inc. BCR
60 Barr Pharmaceuticals Inc. BRL
61 Bausch & Lomb BOL
62 Baxter International Inc. BAX
63 BB&T Corporation BBT
64 Bear Stearns Cos. BSC
65 Becton Dickinson BDX
66 Bed Bath & Beyond BBBY
67 Bemis Company BMS
68 Best Buy Co. Inc. BBY
69 Big Lots Inc. BIG
70 BIOGEN IDEC Inc. BIIB
71 Biomet Inc. BMET
72 BJ Services BJS
73 Black & Decker Corp. BDK
74 Block H&R HRB
75 BMC Software BMC
76 Boeing Company BA
77 Boston Properties BXP
78 Boston Scientific BSX
79 Bristol-Myers Squibb BMY
80 Broadcom Corporation BRCM
81 Brown-Forman Corp. BF.B
82 Brunswick Corp. BC
83 C.H. Robinson Worldwide CHRW
84 CA Inc. CA
85 Campbell Soup CPB
86 Capital One Financial COF
87 Cardinal Health Inc. CAH
88 Carnival Corp. CCL
89 Caterpillar Inc. CAT
90 CB Richard Ellis Group CBG
91 CBS Corp. CBS
92 Celgene Corp. CELG
93 CenterPoint Energy CNP
94 Centex Corp. CTX
95 Century Telephone CTL
96 Charles Schwab SCHW
97 Chesapeake Energy CHK
98 Chevron Corp. CVX

Click Here to see all Beginner Stock Trading Articles


2012 Fortune 500 Companies

An annual list put together by FORTUNE Magazine of the 500 largest companies. This list uses the most recent figures for revenue and includes both public and private companies with publicly available revenue. Over recent years, Exxon Mobil, Walmart, General Electric and Chevron have vied for the top spots. It is considered a mark of prestige to be included in the Fortune 500.

1 – 100      101 – 200      201 – 300      301 – 400      401 – 500
Revenue
Profit
Profit
Rank Company Symbol
($ millions)
($ millions)
Margin
1 Exxon Mobil XOM
452,926.00
41,060.00
9%
2 Wal-Mart Stores WMT
446,950.00
15,699.00
3%
3 Chevron CVX
245,621.00
26,895.00
10%
4 ConocoPhillips COP
237,272.00
12,436.00
5%
5 General Motors GM
150,276.00
9,190.00
6%
6 General Electric GE
147,616.00
14,151.00
9%
7 Berkshire Hathaway BRKA
143,688.00
10,254.00
7%
8 Fannie Mae FNMA
137,451.00
-16,855.00
-12%
9 Ford Motor F
136,264.00
20,213.00
14%
10 Hewlett-Packard HW
127,245.00
7,074.00
5%
11 AT&T T
126,723.00
3,944.00
3%
12 Valero Energy VLO
125,095.00
2,090.00
1%
13 Bank of America Corp. BAC
115,074.00
1,446.00
1%
14 McKesson MCK
112,084.00
1,202.00
1%
15 Verizon Communications VZ
110,875.00
2,404.00
2%
16 J.P. Morgan Chase & Co. JPM
110,838.00
18,976.00
17%
17 Apple AAPL
108,249.00
25,922.00
23%
18 CVS Caremark CVS
107,750.00
3,461.00
3%
19 International Business Machines IBM
106,916.00
15,855.00
14%
20 Citigroup C
102,939.00
11,067.00
10%
21 Cardinal Health CAH
102,644.20
959
0%
22 United Health Group UNH
101,862.00
5,142.00
5%
23 Kroger KR
90,374.00
602
0%
24 Costco Wholesale COST
88,915.00
1,462.00
1%
25 Freddie Mac FMCC
88,262.00
-5,266.00
-5%
26 Wells Fargo WFC
87,597.00
15,869.00
18%
27 Procter & Gamble PG
82,559.00
11,797.00
14%
28 Archer Daniels Midland ADM
80,676.00
2,036.00
2%
29 AmerisourceBergen ABC
80,217.60
706.6
0%
30 INTL FCStone INTL
75,497.60
37.3
0%
31 Marathon Petroleum MPC
73,645.00
2,389.00
3%
32 Walgreen WAG
72,184.00
2,714.00
3%
33 American International Group AIG
71,730.00
17,798.00
24%
34 MetLife MET
70,641.00
6,981.00
9%
35 Home Depot HD
70,395.00
3,883.00
5%
36 Medco Health Solutions MHS
70,063.30
1,455.70
2%
37 Microsoft MSFT
69,943.00
23,150.00
33%
38 Target TGT
69,865.00
2,929.00
4%
39 Boeing BA
68,735.00
4,018.00
5%
40 Pfizer PFE
67,932.00
10,009.00
14%
41 PepsiCo PEP
66,504.00
6,443.00
9%
42 Johnson & Johnson JNJ
65,030.00
9,672.00
14%
43 State Farm Insurance Cos. STFC
64,305.10
845
1%
44 Dell DELL
62,071.00
3,492.00
5%
45 WellPoint WLP
60,710.70
2,646.70
4%
46 Caterpillar CAT
60,138.00
4,928.00
8%
47 Dow Chemical DOW
59,985.00
2,742.00
4%
48 United Technologies UTX
58,190.00
4,979.00
8%
49 Comcast CMCS
55,842.00
4,160.00
7%
50 Kraft Foods KFT
54,365.00
3,527.00
6%
51 Intel INTL
53,999.00
12,942.00
23%
52 United Parcel Service UPS
53,105.00
3,804.00
7%
53 Best Buy BBY
50,272.00
1,277.00
2%
54 Lowe’s LOW
50,208.00
1,839.00
3%
55 Prudential Financial PRU
49,045.00
3,666.00
7%
56 Amazon.com AMZN
48,077.00
631
1%
57 Merck MRK
48,047.00
6,272.00
13%
58 Lockheed Martin LMT
46,692.00
2,655.00
5%
59 Coca-Cola KO
46,542.00
8,572.00
18%
60 Express Scripts Holding ESRX
46,128.30
1,275.80
2%
61 Sunoco SUN
45,765.00
-1,684.00
-3%
62 Enterprise Products Partners EPD
44,313.00
2,046.90
4%
63 Safeway SWY
43,630.20
516.7
1%
64 Cisco Systems CSCO
43,218.00
6,490.00
15%
65 Sears Holdings SHLD
41,567.00
-3,140.00
-7%
66 Walt Disney DIS
40,893.00
4,807.00
11%
67 Johnson Controls JCI
40,833.00
1,624.00
3%
68 Morgan Stanley MS
39,376.00
4,110.00
10%
69 Sysco SYY
39,323.50
1,152.00
2%
70 FedEx FDX
39,304.00
1,452.00
3%
71 Abbott Laboratories ABT
38,851.30
4,728.40
12%
72 DuPont DD
38,719.00
3,474.00
8%
73 Google GOOG
37,905.00
9,737.00
25%
74 Hess HES
37,871.00
1,703.00
4%
75 Supervalu SVU
37,534.00
-1,510.00
-4%
76 United Continental Holdings UAL
37,110.00
840
2%
77 Honeywell International HON
37,059.00
2,067.00
5%
78 Chico’s FAS Inc CHS
36,915.80
961.4
2%
79 Humana HUM
36,832.00
1,419.00
3%
80 Goldman Sachs Group GS
36,793.00
4,442.00
12%
81 Ingram Micro IM
36,328.70
244.2
0%
82 Oracle ORCL
35,622.00
8,547.00
23%
83 Delta Air Lines DAL
35,115.00
854
2%
84 Liberty Mutual Insurance Group LMG
34,671.00
365
1%
85 World Fuel Services INT
34,622.90
194
0%
86 New York Life Insurance PRIVATE
34,393.50
557.3
1%
87 Plains All American Pipeline PAA
34,275.00
966
2%
88 TIAA-CREF CREF
34,079.00
2,388.40
7%
89 Aetna AET
33,779.80
1,985.70
5%
90 Sprint Nextel S
33,679.00
-2,890.00
-8%
91 News Corp. NWS
33,405.00
2,739.00
8%
92 General Dynamics GD
32,677.00
2,526.00
7%
93 Allstate ALL
32,654.00
788
2%
94 HCA Holdings HCA
32,506.00
2,465.00
7%
95 American Express AXP
32,282.00
4,935.00
15%
96 Tyson Foods TSN
32,266.00
750
2%
97 Deere DE
32,012.50
2,799.90
8%
98 Murphy Oil MUR
31,446.30
872.7
2%
99 Philip Morris International PM
31,097.00
8,591.00
27%
100 Nationwide NFS
30,697.80
-793.1
-2%
1 – 100   101 – 200   201 – 300   301 – 400   401 – 500

Click Here to see all Beginner Stock Trading Articles

Top 500 Companies / Fortune 500 Companies

Definition: The amount of sales generated for every dollar’s worth of assets. It is calculated by dividing sales in dollars by assets in dollars.

Formula:

Asset Turnover


Also known as the Asset to Turnover Ratio.

More Detail:  Asset turnover measures a firm’s efficiency at using its assets in generating sales or revenue – the higher the number the better. It also indicates pricing strategy: companies with low profit margins tend to have high asset turnover, while those with high profit margins have low asset turnover.


Definition: The American Stock Exchange (Amex) is the third largest Stock Exchange in the US by trading volume. It overlooks the trading of approximately 10% of all US traded securities including small-cap stocks, ETF’s and Derivatives.

Definition

Day trading is the act of buying and selling (or shorting and covering) a stock or other investment in the same day.

Day trading has become a very popular way of making money. It can be very profitable or you could lose that money just as quickly as you made it. This activity is performed either directly via a stock exchange trading platform or through online trading websites provided by brokers.

Details

Difficulty

One of the greatest barriers to entry for day trading, not withstanding skills and knowledge, is the amount of money necessary to succeed. If we set a goal of beating the market (because otherwise it wouldn’t be worth the day trader’s time) he would have to make about 10% profit.

It means you would need more than $150,000 just to make minimum wage, without taking into consideration taxes (the capital gains tax owed on day trading is significant), cost of an office, equipment, and any analysis software you might be using. Even with that investment, only about 1 in 100 investors who day trade on their own turn a profit.

Another pitfall is that people wrongly believe that they can be just as good as the institutional investors because they can “get lucky”, or learn while doing.  However, the greatest success can be found by either working through a day trading firm (and get access to their tools and reseach), and by using a simulator first to test your strategies.

Having what it takes

Let’s face it, day trading is not easy and can be very stressful. The following are some characteristics of good day traders:

Finance Knowledge – A wealth of knowledge of Technical Patterns, understanding how news affects stock prices and a very good understanding of the basics among others, is necessary.

Interest – You will need a strong interest to watch stocks and market news if you are doing this on a regular basis. If you do not have sufficient interest, the likelihood is you will quit before becoming profitable.

Perseverance – There can be very high high’s and very low low’s so it’s important to be able to persevere through the low’s.

Quickness – Day trading is measured in seconds and milliseconds, being able to react quickly and place trades quickly is essential.

Multi-Tasking – Just like being a fast trader, one must also be able to see and look at multiple different screens with large quantities of information to make quick and informed decisions.

Independence – Day trader’s frequently spend their time in front of a computer screen, oftentimes alone in their office. It can be quite daunting to have little human contact.

Managing Stress – As we stated earlier, day trading is stressful, more than many other jobs as there are constant demands for your attention and one big mistake could be incredibly costly.

Organized – Being prepared is also very important to day traders, a lot of the work can be done after the market closes at night or before the market opens in the morning. If you are not able organize and prepare your information before the chaos begins, it will be that much harder to manage.

Technologically Inclined – Charts, news feeds, trading screens, internet, these are all things that are absolutely necessary to get an edge on the competition in the day trading game. Without a technologically inclined mind, fixing internet problems and upgrading your layout to multiple screens could be quite daunting and expensive.

Tips

So you’ve decided to start day trading, what’s next?

Learning – What’s important is to start learning hands on as much as possible before losing your money learning. Then, once your consistently profitable, you can apply what you’ve learned without losing money while your learning.

Selection – One of the main challenges for a day trader is that stock prices usually change very little throughout the day and is usually reserved to the first few hours of trading. In order to make profitable trades you will need to find stocks with higher volatility, have sufficient volume and have a low enough price to be able to invest larger quantities of money and thus be able to buy more shares.

Spread – The other problem you must overcome is the bid/ask spread. Finding stocks that meet the criteria for profitable trades should also take into account the spread. A large spread with a liquidity problem could easily make even the most successful day trader lose money.

Commission Commission can be around 10$ a trade and can quickly eat your profit, especially if you only trading small amounts. Luckily, there are many different brokerages with cheaper commissions which are often based on how many trades you make, so it’s important to shop around.

Taxes and Businesses Day trading could be considered a business where you live and therefore require certain procedures to be followed before you start day trading, especially if you are investing other peoples money. Tax considerations can also be very important to the overall profit you make. It is very important to get informed about these before

Day Trading RulesDon’t forget! Make sure to check the Day Trading Rules before opening a real brokerage account and day trading!

Following is a list of the most popular (largest) mutual funds.
 

Rank
Symbol Fund Name
1
PTTRX PIMCO:Tot Rtn;Inst
2
FDRXX Fidelity Cash Reserves
3
VMMXX Vanguard Prime MM;Inv
4
VTSMX Vanguard T StMk Idx;Inv
5
VINIX Vanguard Instl Indx;Inst
6
CJPXX JPMorgan:Prime MM;Cap
7
FCNTX Fidelity Contrafund
8
VFIAX Vanguard 500 Index;Adm
9
VTSAX Vanguard T StMk Idx;Adm
10
CAIBX American Funds CIB;A
11
AMECX American Funds Inc;A
12
AGTHX American Funds Gro;A
13
VIIIX Vanguard Instl Indx;InsP
14
CWGIX American Funds CWGI;A
15
AIVSX American Funds ICA;A
16
POIXX Federated Prime Obl;Inst
17
AWSHX American Funds Wash;A
18
TMPXX BlkRk Lq:TempFund;Instl
19
FKINX Franklin Cust:Inc;A
20
DODGX Dodge & Cox Stock
21
FIPXX Fidelity IMM:Prm MM;Inst
22
VITSX Vanguard T StMk Idx;Inst

Click Here to see all Beginner Mutual Fund Articles


Definition:
Mutual Fund screeners are available on countless websites and trading platforms. They allow users to choose trading instruments that are suitable for certain criteria profile. Users will be able to screen for Mutual Funds by data as well as market capitalization, price, dividend yield also a 52-week price change percentage, typical volume and normal five-year return on investment (ROI). There are several trading platforms and software that allow users to screen utilizing technical indicator data. For instance, one can filter for Mutual Funds that are bargaining above their 200-day climbing average or whose Relative Strength Index (RSI) values are between a designated range.

More Detail:
By using an Mutual Funds screening tool, investors are able to find Mutual Funds that accommodate a specific set of criteria. Investors utilize screeners to Mutual Funds that are poised to be successful over time. If you’re an active trader, you may use stock screening tools to find high probability set-ups for short-term positions. These users may enter a variety of number of filters. As more filters are adapted, fewer stocks will be shown on the screener. Stock screeners grant investors and traders to examine hundreds of Mutual Funds in a short length of time, making it possible to draw ut those Mutual Funds that will not meet the user’s requirements and focus on the instruments that are within the user-defined metrics.

Click Here to see all Beginner Mutual Fund Articles


American investors, covering the past decade, have conclusively come around to mutual funds so they may save towards their retirement as well as other financial targets. Mutual funds may offer the benefits of diversification and professional management. However, along with other investment options, investing in mutual funds entails risk. Also taxes and fees will decrease a fund’s returns. It’s important to know both the upside and the downside of mutual fund investing and in what manner to select products that reflect your goals and acceptance for risk.

Advantages and Disadvantages

All investment has benefits and loss. Nevertheless it’s imperative to keep in mind the features that are important to one investor may not be valuable to you. Whether any specific feature is a certain usefulness for you will count on your individual circumstances. Mutual funds provide an attractive investment choice, American investors, covering the past decade, have conclusively come around to mutual funds so they may save towards their retirement as well as other financial targets.  They may include the following features.

Professional Management — Expert money managers analyze, choose, as well as watch the performance of the securities the fund purchases.

Diversification — Diversification is an investing approach that has, at times, been summed up as “Don’t put all your eggs in one basket.” Broadening one’s  investments across a variety of companies and industry sectors can assist in lowering your risk if a company or sector is unsuccessful. Many investors discover it’s easier to accomplish diversification by way of ownership of mutual funds instead of through ownership of individual bonds or stocks.

Affordability — There are several mutual funds that accommodate investors who may not have a bunch of funds to invest by fixing relatively low dollar amounts for subsequent monthly purchases, initial purchases, or both.

Liquidity — Mutual fund investors can quickly recover their shares at a existing NAV, as well as any fees and charges assessed on redemption, any time.

Mutual funds have features that some investors might view as disadvantages, for example:

Costs Despite Negative Returns — Investors are required to pay sales charges, annual fees, and other expenses no matter how the fund delivers. Relying on the timing of the investment, taxes may have to be paid on any capital gains distribution investors receive, despite whether or not the fund goes on to perform unfavorably when the shares were purchased.

Lack of Control — Investors normally are unable to determine the exact make-up of particular fund’s portfolio at any particular time, neither can they wholly influence which securities the fund manager sells and purchases or the timing of those trades.

Price Uncertainty — Pricing information for an individual stock can be obtained in real-time, or close to real-time, with comparable ease by looking into financial websites or also by contacting your broker. If you wish, you can check how a stock’s price revises from hour to hour, and if you want, from second to second. By comparison with a mutual fund, the price at which you buy or purchase shares will normally count on the fund’s NAV, which the fund may not compute until several hours after you have established your order. At least once every business day mutual funds have to calculate their NAV, normally after the major U.S. exchanges closes.


Click Here to see all Beginner Mutual Fund Articles


As an investor, how can you know which funds are best for your situation? Taking advantage of independent researchers is a good road to take, and one of the best choices for independent researches in mutual funds is Morningstar.

What is Morningstar? They are a provider of independent investment research in the United States as well as internationally. Morningstar provides much of their information for free. (morningstar.com) You can go to this site to research independent assessment on any mutual fund you’d like as well as other investments. Morningstar is such a trusted tool that many funds will utilize their ratings in their own advertisements.

So how do I use it? Go to your computer and look up morningstar.com. Just enter the name of a mutual fund you’re interested in. Let’s take a look at Vanguard 500. First you’ll see a plethora of information about your fund. It will seem a bit overwhelming for a beginning investor. If you need help just click on the “Data Interpreter” link on the left hand menu, it will certainly tell you some of the data. You may need to use the “Data Interpreter” frequently when you first get started with funds. That’s all right, that’s what it’s there for.

Information overload! What’s really important? An important item to look at when you’re assessing a fund with Morningstar’s data is to examine the “Key Stats” box in the upper right. Be sure to look at the Morningstar Rating (which will be discussed later on) as well as the Expense Ratio (which should be low).  Also examine the trailing returns in the Performance section, but mainly at the five year trend.

What do the stars mean? Every fund examined by Morningstar is supplied with a star ranking, from one to five stars, that gives you the information you need for the fund. Morningstar gives you a detailed explanation of how these stars are generated. Normally, many investors do not spend much time checking out anything below three stars, however, if it has three stars or up make sure to take a look at it more closely because many conservative and index funds are given three stars.

One bad thing, although… As you begin to really get involved in the information given, you’ll see that some of the interesting items you want to research requires a premium membership. You can always make a list of things you want to look more closely at and then sign up for a 14-day trial of the premium membership. You can then take a look at the funds you’re interested in then cancel the service.

To sum things up, Morningstar is a great tool to check out fundamental information about a fund that you may have seen advertised or heard about from an associate. It gives you the good real story without any partiality.


The following list is the 100 biggest Mutual Fund Families according to Morning Star. The top fund family as of 2013 is Fidelity Investments.

Family Retail Net Assets
# of Distinct Fund
1 Fidelity Investments $984,173,589,258
315
2 Vanguard Group $962,331,327,507
148
3 American Fund $956,584,547,987
42
4 Franklin Templeton Investments $377,385,331,414
122
5 T. Rowe Price & Co. $345,725,591,811
110
6 Columbia Management $167,493,529,444
140
7 Dodge & Cox $126,826,526,974
5
8 OppenheimerFund $125,473,946,434
72
9 John Hancock Fund $119,789,419,458
225
10 Pacific Investment Management Co. $118,411,876,036
73
11 Invesco Ltd. $95,323,126,745
92
12 BlackRock Inc. $90,785,119,662
116
13 Janus Capital Group $84,717,855,431
48
14 American Century Investments $71,948,919,961
86
15 MFS Investment Management $71,059,542,832
74
16 Lord Abbett & Co. $66,647,971,069
42
17 ING Retirement $58,294,891,374
150
18 Wells Fargo Advantage Fund $48,938,991,118
101
19 Putnam Investments $48,697,487,901
79
20 AllianceBernstein Inc. $48,012,344,847
74
21 Eaton Vance Corp. $45,749,419,375
91
22
DWS Investments $43,664,723,778
67
23
JPMorgan Fund $43,495,216,232
108
24
USAA $41,901,152,367
41
25
Legg Mason Inc. $40,997,886,898
87
26
Hartford Mutual Fund $39,801,202,624
81
27
Dreyfus Fund $35,223,057,365
105
28
Ivy Fund $34,953,774,009
30
29
First Eagle Fund $34,849,628,600
5
30
Northern Fund $34,626,707,067
51
31
Schwab Fund $34,218,636,841
47
32
Principal Fund $33,220,356,251
63
33
Prudential Investments $32,560,310,174
44
34
Thornburg Investment Management $30,706,861,162
16
35
Royce Fund $30,583,106,754
30
36
Russell Investments $29,943,773,637
39
37
Artisan Fund $28,990,199,955
12
38
Federated Investors $27,512,268,214
66
39
Goldman Sachs Asset Management $26,350,742,126
72
40
Pioneer Investments $24,616,061,833
37
41
Davis Fund $24,203,544,825
8
42
Natixis Fund $22,552,861,400
28
43
Oakmark Fund $22,312,816,162
7
44
Waddell & Reed Inc. $21,894,219,733
22
45
VALIC $20,406,552,997
45
46
TIAA-CREF $20,067,405,527
50
47
Nuveen Investments $19,271,984,888
106
48
Delaware Investments $18,747,941,089
64
49
Vantagepoint Fund $18,216,359,065
29
50
MainStay Fund $18,123,576,513
43
51
Old Westbury Fund Inc. $17,636,346,867
7
52
Transamerica Fund $17,340,958,096
93
53
Manning & Napier Advisors $16,369,195,769
23
54
Calamos Investments $16,360,555,306
13
55
BNY Mellon Fund $15,963,624,304
23
56
Neuberger Berman Group $15,217,723,388
29
57
Permanent Portfolio Fund $14,821,586,943
4
58
Longleaf Partners $14,508,938,037
3
59
Fairholme Fund $14,058,073,355
3
60
Matthews Asia Funds $13,560,751,270
12
61
Gabelli Asset Management $13,020,562,830
25
62
Allianz Funds $12,960,469,849
51
63
Baron Capital Group $12,527,515,310
10
64
First Pacific Advisors $12,455,433,886
5
65
Maxim Series Funds $10,996,426,012
61
66
Loomis Sayles & Co. $10,925,491,068
10
67
GE Asset Management $10,897,486,051
15
68
State Farm Mutual Funds $10,826,906,509
18
69
RS Investments $10,606,047,447
24
70
Virtus Investments $10,498,384,926
43
71
Metropolitan West Funds $10,406,038,414
7
72
UBS Global Asset Management $10,102,902,052
30
73
Thrivent Funds $9,903,562,940
25
74
GuideStone Funds $9,670,399,927
24
75
Rydex|SGI $9,608,506,903
77
76
Scout Funds $9,379,039,210
9
77
Calvert Investments $8,713,187,853
23
78
Yacktman Funds $8,568,117,636
2
79
American Beacon Funds $8,491,675,061
20
80
Harbor Funds $8,475,794,825
29
81
Morgan Stanley Investment Management $8,127,326,739
43
82
Nationwide Funds $8,125,755,520
30
83
Hussman Investment Trust $7,910,614,873
3
84
Wasatch Funds $7,675,561,762
18
85
Sentinel Funds $7,097,806,466
15
86
Smith Barney Funds $6,952,704,934
10
87
Selected Funds $6,897,544,334
2
88
Managers Funds $6,575,499,244
39
89
Credit Suisse Asset Management $6,393,255,467
7
90
Artio Global Funds $6,337,989,656
10
91
First Investors Corp. $6,263,292,524
26
92
FMI Funds $6,184,822,872
5
93
Victory Funds $5,760,986,361
17
94
Tweedy Browne Co. $5,698,755,076
4
95
Cohen & Steers Inc. $5,634,135,061
10
96
SunAmerica Asset Management Corp. $5,532,399,724
27
97
IVA Funds $5,357,195,024
2
98
Parnassus Investments $5,179,512,432
6
99
Merger Funds $5,043,180,465
1
100
Buffalo Funds $5,035,261,647
10

Use your knowledge of the Largest Mutual Fund Families in our stock game.

We offer an unbiased view of the ten largest U.S. mutual funds — pointing out the pros and cons of both active and passive funds, while simultaneously suggesting real alternatives. Almost all of these funds come in different shares classes, each with their own fee structure, and are ranked by assets under management as reported by Morningstar.

1. Pimco Total Return (PTTAX) — Assets: $263 billion

Topping the list is Pimco Total Return, a bond fund managed by the famous Bill Gross. Mr. Gross has quite a reputation in the fixed income world, and for good reason—his long-term track record is very good. He made some poor market calls in 2011, namely shortening the fund’s duration and reducing Treasury exposure. As a result, he missed out on the drop in interest rates which drove a solid rally in the latter half of the year. Only time will tell how frequent these slip ups occur. The net annual expense ratio for A shares is 0.85% (with a 3.75% front end load) and 1.60% for C shares, although some of the other classes have lower fees. The institutional shares, for instance, cost about 0.46% per year.

Pros:

  • Solid long-term track record
  • Capable management team with extensive experience in fixed income

Cons:

  • The portfolio’s duration is now a little longer than we would like
  • While it hasn’t created major issues so far, the significant assets base could limit its ability to move in and out of the best investments
  • Depending on the share class, this fund can be expensive

It’s hard to argue with exposure here. Following the 2011 slip up, Gross increased duration and benefitted from falling rates in 2012, and has since reduced duration again.  So despite its large size this fund remains relatively nimble. In the end, it may depend on what share class is purchased. Each holds a different set of fees, and paying anything over 1% annually is hard to justify for a bond fund, especially considering the existence of cheaper ETF alternatives.

2. Vanguard Total Stock Market Index Fund (VTSMX) — Assets: $190 billion

Next is the Vanguard Total Stock Market Index Fund. Rather than mimic the S&P 500, this fund provides capitalization weighted exposure to the entire US equity universe across all sizes and styles. As a passively managed index fund it does not attempt to outperform the market. It comes in two shares classes: Investor shares and Admiral shares. There is a $3,000 minimum on the former and a $10,000 minimum on the latter if opening a new account. The net annual expense ratios are 0.17% and 0.05% respectively.

Pros:

  • Very inexpensive relative to actively managed stock funds, as well as other passively managed index funds
  • It provides more exposure to mid and small cap companies than funds tracking the S&P 500

Cons:

  • The fund is market cap weighted, so while it provides exposure to mid and small it remains heavily concentrated in large cap
  • Capitalization-weighted indexes suffer from an inherent bias toward “hot” segments of the market, and often feature concentrated economic sector bets

Vanguard is well known for keeping investor costs low. And this fund’s broad exposure to US equities make it a prime candidate for a core domestic holding, particularly within qualified retirement plans that cannot invest in ETFs. However, where available we suggest going with its ETF alternative: the Vanguard Total Stock Market ETF (VTI). Its expense ratio is almost as low as the Admiral shares at 0.06% and there is no minimum investment. Given this is a market cap weighted fund concentrated primarily in large firms, we also suggest adding exposure to small and mid through supplemental ETF. The Vanguard Mid-Cap ETF (VO) and Vanguard Small Cap ETF (VB) are viable, low-cost options.

3. American Funds Growth Fund of America (AGTHX) — Assets: $115 billion

The most popular of the American Funds offerings is the Growth Fund of America. It is an actively managed fund, which according to American Funds’ website, invests at least 65% of assets in common stocks, of which up to 25% can be international. The net annual expense ratios for A shares and C shares is 0.68% (plus a 5.75% front end load) and 1.46%, respectively.

Pros:

  • 10-year performance for A shares relative to the S&P 500 (using SPY as a proxy) is strong, but investors should always be aware of survivorship bias when considering long term records of mutual funds
  • American Funds has a reputation for attracting talented managers and analysts
  • Fairly good sector exposure

Cons:

  • Very expensive
  • Shorter-term performance is less than spectacular with both A shares and C shares trailing SPY on a one-, three-, and five-year basis
  • High asset base could limit investment options
  • American Funds in general are suffering from a massive outflow of assets. By definition, this causes forced selling and creates a performance headwind

Despite American Funds’ reputation, it is extraordinarily difficult to justify paying such high fees given underperformance relative to low cost index ETFs like the SPDR S&P 500 ETF (SPY). More importantly, a closer comparison based on the fund’s style and size characteristics is the Vanguard Growth ETF (VUG), which tracks the Russell 1000 Growth Index. While the ETF hasn’t been around long enough to perform a ten-year comparison, it significantly outperformed A shares and C shares on a one-, three-, and five- year basis (as of 6/30/2012). Yes, the Growth Fund of America has a foreign component which makes a direct comparison to US equities inaccurate. And yes, foreign has done worse than domestic in recent years. But even if you created a 75/25 blend (the maximum the fund is allowed to invest in foreign) of VUG and VEU (Vanguard FTSE All World ex-US ETF) you would have still handily beat this fund over the same one-, three-, and five-year basis. All of this makes a strong case for ETFs. And if it’s in a qualified retirement plan with limited investment options, a lower cost index fund is likely a better bet.

4. Vanguard 500 Index Investor Fund (VFINX) — Assets: $111 billion

Coming in at number four is the Vanguard 500 Index Investor Fund. Passive index fund tracks the S&P 500, meaning it is primarily invested in large cap stocks. Like the Vanguard Total Stock Market Fund, it comes in two share classes: Investor shares and Admiral shares. Net annual expense ratios are 0.17% and 0.05%, respectively.

 Pros:

  • Very inexpensive relative to actively managed stock funds, as well as other passively managed index funds
  • Low portfolio turnover of only 4% provides greater tax efficiency

Cons:

  • The fund is market cap weighted, and given it tracks the S&P 500 there is minimal exposure to mid and small cap companies
  • Capitalization weighted indexes suffer from an inherent bias toward “hot” segments of the market, and often feature concentrated economic sector bets

This is a solid choice for core domestic equity exposure. But given its concentration in large cap, it is wise to add supplemental mid and small cap exposure. Vanguard also offers a cheap ETF alternative: Vanguard S&P 500 ETF (VOO). While volume isn’t as high as the SPDR S&P 500 ETF (SPY), it carries a lower net annual expense ratio at 0.05%. There is also an institutional version of this fund, the Vanguard Institutional Index (VINIX), which charges a meager 0.04% annually.

5. Vanguard Total Bond Market Index (VBMFX) — Assets: $111 billion

The fifth largest mutual fund is the Vanguard Total Bond Market Index. It comes in Investor and Admiral shares, with annual expense ratios of 0.22% and 0.10%, respectively. This is a passively managed fixed income fund that attempts to track the Barclays Capital U.S. Aggregate Float Adjusted Index—a broad value weighted index of dollar denominated investment grade bonds. The primary holdings are US Treasuries, corporate bonds, and agency mortgage-backed securities. According to the prospectus, the fund maintains a dollar-weighted average maturity range of 5 to 10 years.

 Pros:

  • Provides broad exposure to multiple areas of the fixed income market
  • Inexpensive

Cons:

  • We believe maturity and duration are a bit long given the current interest rate environment
  • No exposure to inflation-protected bonds
  • Almost no international exposure

This fund is cheap and it also has a low cost ETF brother: Vanguard Total Bond Market ETF (BND). Its broad fixed income exposure makes it a good candidate for a core fixed income holding, but it’s not without drawbacks. It could be improved with the addition of inflation-protected and international bonds. Moreover, its weighted average maturity of over 7 years, and duration of 5 years, means there’s a sizeable amount of interest rate risk. We would suggest a shorter maturity/duration profile to protect against a potential jump in rates.

6. American Funds EuroPacific Growth (AEPGX) — Assets: $94 billion

Coming in at number six is the EuroPacific Growth fund. This is a growth-oriented fund that, according to the prospectus, normally invests at least 80% of assets in European and Pacific Basin securities. According to Morningstar.com, the fund had over 20% of its equity weight in Emerging Markets. It comes in many share classes. The A shares carry a 5.75% front end load and 0.84% annual expense ratio, while the C shares annual expense ratio comes in at 1.62%.

 Pros:

  • Good regional exposure spanning both developed and emerging markets
  • American Funds has a reputation for attracting talented managers and analysts
  • With over 300 equity holdings, the fund is broadly diversified

Cons:

  • Very expensive
  • The fund is heavily concentrated in large cap stocks with minimal exposure to small and mid
  • American Funds in general are suffering from a massive outflow of assets. By definition, this causes forced selling and creates a performance headwind

This is an expensive mutual fund which may not be worth the price given mixed performance figures. A close comparison based on the fund’s makeup is the MSCI All Country World ex USA Index. The A shares bested this index over most time periods (one-, three, five-, and ten-year). But when factoring in the 5.75% sales load, the fund underperformed on a one- and three-year basis, and was only slightly ahead of the index on a ten-year basis through 6/30/2012. It’s also important to keep in mind these figures exclude the impact of taxes on distributions and sales of fund shares, a very real headwind. In other words, this is another example where a lower cost, more efficient ETF like VEU (Vanguard FTSE All-World ex-US) could make more sense. But if your international choices are limited, you could do worse.

7. Fidelity Contrafund (FCNTX) — Assets: $81 billion

With one showing in the top ten, Fidelity’s Contrafund. This is another large growth fund. But, its focus is primarily on the US, with over 88% of assets in domestic equities through mid-2012, according to Fidelity.com. The remainder is in foreign developed markets and cash, with a small weight in emerging markets. There is no front end load, and total annual expenses are approximately 0.81%.

Pros:

  • 10-year performance is very strong, but investors should always be aware of survivorship bias when considering long term records of mutual funds
  • Offers some diversification into foreign stocks

Cons:

  • Significant sector bets with almost half of portfolio allocated to Technology and Consumer Cyclical stocks
  • Almost no exposure to small cap or value stocks

With a 0.81% expense ratio and no front end load, this mutual fund isn’t excessively expensive. Performance is another story. A direct comparison is difficult given the small foreign component, but based on its size and style characteristics, the Vanguard Growth ETF (VUG) would be the closest match, which tracks the Russell 1000 Growth index. Despite strong ten-year results, the Contrafund underperformed VUG on a one- and three-year basis, and was about even on a five-year basis (as of 6/30/2012). And again, this does not account for taxes which would result in even lower performance. This fund’s concentrated bets don’t seem worth the risk given these performance figures. We would suggest a combination of lower cost ETFs to better diversify across size, styles, and regions.

8. American Funds Capital Income Builder (CAIBX) — Assets: $76 billion

The Capital Income Builder comes in at number eight. This fund seeks higher yielding securities to provide investors with an income stream. According to American Funds’ website, it can invest in up to 50% internationally and normally has at least 90% invested in income-producing assets. As of mid-2012, it had approximately 33% in domestic equities, 37% in international equities, and 21% in fixed income, according to Morningstar.com. While there are multiple classes of this fund, A shares carry a 0.61% annual expense ratio and a 5.75% front end load. C shares come with no load, but a 1.43% annual expense ratio.

Pros:

  • American Funds has a reputation for attracting talented managers and analysts
  • Good regional diversification within equities

Cons:

  • Heavily concentrated in large cap with minimal exposure to small
  • Overweight to non-economically sensitive sectors such as Consumer Defensive, Communication Services, and Utilities
  • American Funds in general are suffering from a massive outflow of assets. By definition, this causes forced selling and creates a performance headwind

This mutual fund is a bit more specialized given its focus on high yielding equities and fixed income. As such, a long-term comparison is difficult given high yield ETFs haven’t been around for very long. But you could construct a similar portfolio of 40% high yield domestic equities, 40% high yield foreign equities, and 20% diversified fixed income through the following ETFs: iShares Dow Jones Select Dividend Index (DVY), SPDR S&P International Dividend (DWX), and Vanguard Total Bond Market (BND). Doing this would result in a weighted annual expense ratio of 0.36%. The ETF portfolio outperformed A shares and C shares on a three-year basis, but underperformed both on a one-year basis. So again, this fund’s performance is spotty.

9. American Funds Income Fund of America (AMECX) — Assets: $72 billion

The Income Fund of America comes in at number nine. This is a balanced fund that has maintained approximately 55% to 65% in global equities over the last five years, according to Morningstar.com. The remainder is mostly allocated to bonds and cash. Its stated investment objective is to provide current income while striving for growth. As such, it also looks for higher yielding assets, very similar to the Capital Income Builder fund. The fund’s A shares carry a 5.75% front load and 0.58% annual expense ratio, while C shares carry a 1.39% annual expense ratio.

Pros:

  • Relatively short fixed income maturity profile means this fund isn’t excessively exposed to interest rate risk
  • Longer-term performance is very strong, but investors should always be aware of survivorship bias when considering long term records of mutual funds
  • American Funds has a reputation for attracting talented managers and analysts

Cons:

  • Within equities, this fund is predominately allocated to large cap with little exposure to small
  • International equity weight could be a bit higher and there is minimal exposure to emerging markets
  • Bond exposure is largely concentrated in corporates and there is no exposure to inflation-protected securities
  • American Funds in general are suffering from a massive outflow of assets. By definition, this causes forced selling and creates a performance headwind
  • Particularly expensive considering high bond and cash allocation

While this fund offers diversification across stocks, bonds, and cash, as well as foreign and domestic securities, concerns remain. Its focus on high yielding securities leaves it underweight to economically sensitive sectors like Basic Materials and Technology. This, coupled with fixed income exposure, served the fund well over 2011 relative to broader equity indices. But it could result in lower returns moving forward should global economic conditions improve. Much like the previous example, this is another situation where longer term comparisons to ETFs are difficult. However, you could use the same two high yielding equity ETFs as before (DVY and DWX), combined with iShares iBoxx $ Investment Grade Corp. Bond ETF (LQD) to account for the fund’s sizeable corporate bond exposure. Using a 50%, 15%, and 35% allocation to these ETFs, respectively, you would have bested both A shares and C shares on a one-, three-, and five-year basis. As such, this fund’s limited diversification benefits hardly seem worth the cost.

10. Vanguard Total International Stock Index (VGTSX) — Assets: $68 billion

Rounding out the list is the Vanguard Total International Stock Index Fund. As a passively managed index fund it does not attempt to outperform the market. It comes in two shares classes: Investor shares and Admiral shares. There is a $3,000 minimum on the former and a $10,000 minimum on the latter if opening a new account. The net annual expense ratios are 0.22% and 0.18% respectively.

Pros:

  • Broad international exposure spanning both developed and emerging markets
  • Offers exposure to mid and small cap foreign companies
  • Very inexpensive relative to actively managed stock funds, as well as other passively managed index funds
  • Low portfolio turnover of only 3% provides greater tax efficiency

Cons:

  • The fund is market cap weighted, so while it provides exposure to mid and small it remains heavily concentrated in large cap
  • Capitalization-weighted indexes suffer from an inherent bias toward “hot” segments of the market, and often feature concentrated economic sector bets

With exposure to developed and emerging markets, as well as mid and small cap, there are few funds with international exposure as broad as this. There is also an ETF version with same annual expense ratio as Admiral shares: Vanguard Total International Stock Index ETF (VXUS). However, volume is not as high as VEU (Vanguard FTSE All-World ex-US), which also offers international exposure for the same price, albeit with more limited mid and small cap exposure.

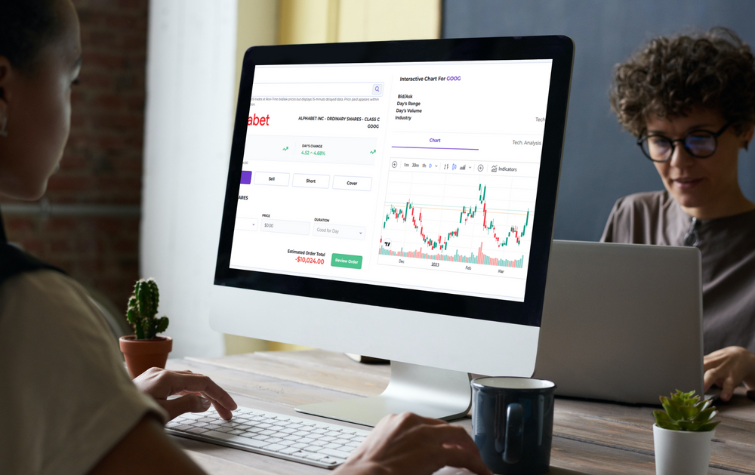
The possible choices for investing in a mutual fund is less complicated than you think. But how do you proceed or which one is the best for you based on your needs? Many people feel the same way.

Identifying Goals and Risk Tolerance

Prior to selecting shares in any fund, as an investor you must first determine your goals and desires for the money invested. Do you want long-term capital gains, or perhaps a current income is preferred? How will you use your money? Towards payment of college expenses or to supplement a retirement a long time away? Recognizing a goal is valuable since it will help you to reduce the large list of over 8,000 mutual funds in the public domain.

Additionally, investors should contemplate the goal of risk tolerance. Will you as an investor be able to manage and rationally accept huge swings in portfolio value? Perhaps a more conservative investment is warranted. Analyzing risk tolerance is as vital as choosing a goal. Ultimately, what value is an investment if the investor cannot sleep at night?

Lastly, the topic of time horizon needs to be addressed. Investors have to consider the time frame they have to tie up their money, or if they expect any liquidity concerns in the relative future. This is important because mutual funds have sales charges and can take a big chunk out of an investor’s return over insufficient periods of time. Mutual fund holders should ultimately have an investment horizon with at least five years or longer

Style and Fund Type

Perhaps as an investor you plan to utilize the money in the fund for a long-term need and you’re willing to estimate a reasonable amount of volatility and risk, then the objective one may be appropriate is a long-term capital appreciation fund. These types of funds are considered to be explosive in nature and usually sustain a high allotment of their assets within common stocks. There is a likelihood for a big reward over a period of time.

As an alternative, in case the investor needs their current income, they could obtain shares in an income fund. Two of the more common holdings in an income fund are government and corporate debt. There are instances, of course, when an investor has a longer-term necessity, but is against or unable to assume considerable risk. In this instance, an equal fund that contributes in stocks and bonds perhaps be the best choice.

Charges and Fees

Mutual funds will make investors pay for fees, this is how they make their money. To understand the various kind of fees that you may encounter when acquiring an investment is essential. Several funds charge a sales fee known as a load fee, which can either be charged upon the sale of the investment or at the initial investment. A back-end load fee is required when an investor sells the investment made by the investor, while a front-end load fee is paid out of the original investment.

For the most part, this is usually done before a set time period, like seven years from the purchase. The front-end and back-end loaded funds usually charge 3% to 6% of the full amount invested or allocated. Every now and then, this number can go as high as 8.5% by law. The intention is to cover any administrative fees and hinder turnover associated with the investment. Depending on the mutual fund, fees can go towards the broker for selling the mutual fund or towards the fund itself, sometimes resulting in lower administration fees at a later date.

To prevent these sales fees, keep an eye for no-load funds. These will not charge a front-end or back-end load fee, be aware other fees in a no-load fund. A good example is the management expense ratio as well as other administration fees, as they can be rather high. Several other funds charge 12b-1 fees, which are included into the share price and are utilized by the fund for sales, promotions and other activities associated to the distribution of fund shares. These fees come right off of the disclosed share price at a proposed point in time.

Accordingly, investors are at times not aware of the fee at all. The 12b-1 fees by law can be as much as 0.75% of a fund’s average assets annually. An important tip when analyzing mutual fund sales literature, the investor should be attentive for the management expense ratio. Actually, that one number can benefit in clearing up any and all confusion as it relates to sales charges. The ratio simply is the total percentage of fund assets being charged to cover fund expenses. The higher the ratio, the lower the investor’s return will be at the end of the year.

Evaluating Managers and Past Results

As you would do with all your investments, investors must analyze a fund’s past results. The following is a sample list of queries that future investors should research when reviewing the historical record:

  • Did the fund manager deliver results that were in keeping with general market returns?
  • Was the fund more explosive than the big indexes (did it’s returns change drastically throughout the year)?
  • Was there an extremely high turnover (which may result in bigger tax liabilities for the investor)?

This information is imperative since it will give the investor awareness into how the portfolio manager reacts under certain conditions, and what the trend has been in terms of turnover and return. Just remember, past achievements have no guarantee towards future results. So before buying into a fund, be sure it makes sense to look over the investment company’s portfolio to examine any information regarding anticipated trends in the market for the years ahead. Most of the time, a impartial fund manager will help the investor with some sense of the prospects for the fund and/or of it’s holdings throughout the year(s) in the future as well as let you know about general industry trends that could be helpful.

Size of the Fund

Normally, the amount of a fund does not slow down its competency to meet its investment goals. Moreover, there are situations when a fund can be too big. Back in 1999, Fidelity’s Magellan Fund, topped $100 billion in assets and they were forced to adapt its investment procedure to accommodate the large daily money inflows. Rather than being smart and purchasing small- and mid-cap stocks, it changed its center of attention largely towards larger capitalization growth stocks. As a result, its performance suffered. When should you worry that big is too big? There are no benchmarks that are definite, however that $100 billion mark really makes it hard for a fund manager to get a position in a stock and dispose of it without dramatically running up the stock on the going up and pushing it on the way down. It makes the procedure of buying and selling stocks with any kind of obscurity almost impossible.

The Bottom Line

Choosing a mutual fund seems like a frightening task, just know your objectives and taking a chance is half of the battle. Be sure to follow this tip of due diligence prior to selecting a fund, you will increase your chances of success.

Click Here to see all Beginner Mutual Fund Articles

Definition:

Mutual fund charges and costs are fees that may be acquired by investors who possess mutual funds. Managing a mutual fund involves costs, including investment advisory fees, shareholder transaction costs, and marketing and distribution charges. These funds are passed along as costs to investors in various ways.

Other funds set “shareholder fees” straight onto investors whenever they purchase or sell shares. Additionally, all funds have common, continuous, fund wide “operating expenses.” Funds normally pay their operating expenses out of fund assets, which means that investors indirectly are charged for these costs. Apparently insignificant, fees and expenses may substantially reduce an investor’s earnings.
 
Types of Fees

Redemption fee: Redemption Fee is substitute fee that a few funds charge their shareholders when they sell or recover shares. Contrary to a deferred sales load, a redemption fee is yielded to the fund – not to a Stockbroker – and is normally used to bear the fund costs associated with a shareholder’s redemption.

Purchase fee: Purchase Fee is a kind of charge that some funds have their shareholders pay when they purchase shares. Unlike a front-end sales load, a purchase charge is paid to the fund – not to a Stockbroker – and is normally infringed to defray a bit of the fund’s costs connected to the purchase.

Exchange fee: Exchange Fee is a fee that some funds set on shareholders if they trade or move to a different fund within the identical fund group or “family of funds.”


Periodic fees

Management fee: Management fees are charges that are distributed out of fund assets to the fund’s investment adviser. These go towards investment portfolio management and any other management charges payable to the fund’s investment adviser or its affiliates. The administrative fees payable to the investment adviser are not included in the “Other Expenses” category, they are discussed below. They are also called maintenance fees.
 
Account fee: Account fees are charges that some funds individually impose on investors in association with the maintenance of their accounts. As an example, several funds require an account maintenance charge on accounts whose value is smaller than a certain dollar figure.
 

Other operating expenses

Transaction Costs:  Funds with a large turnover ratio, or investing in unready cash or exotic markets normally face higher transaction costs. These costs are incurred in the trading of the fund’s assets. The Total Expense Ratio costs are normally not reported.
 

Loads

Definition of a load: A load is a type of commission. Load funds show a “Sales Load” with a percentage fee imposed on acquisition or sale of shares. Fees may be incurred at point of purchase or sale depending upon the kind of load a mutual fund exhibits, or it can be a mix of both. The different types of loads are outlined below.

Front-end load: This is frequently affiliated with class ‘A’ shares of a mutual fund. This can also be known as Sales Charge. This is a charge paid when shares are acquired. Also known as a front-end load, this charge typically is distributed to the brokers that sell the fund’s shares. Front-end loads shrink the quantity of your investment. Let’s say you have $1,000 and you’d like to invest it in a mutual fund with a 5% front-end load. The $50 sales load you have to pay comes directly off the top, and the balance of $950 will be invested in the fund. The maximum sales load under the Investment Company Act of 1940 is 9%. The highest sales load under NASD Rules is 8½%.
 
Back-end load: Deferred Sales Charge, which is a fee paid when shares are sold. These are associated with class “B” mutual fund shares. They are also known as a back-end load, this fee normally goes to the Stockbrokers that trade the fund’s shares. Back-end loads begin with a charge of about 5 to 6 percent. These increment discounts are for each year that the investors owns the fund’s shares. The rate at which this charge lessens is shown in the prospectus. The amount of this kind of load depends on the length of time the investor possesses his or her shares and normally decreases to zero depending on if the investor hangs on to the shares long enough.

Level load/low load: It’s a lot like a back-end load in that no sales charges are paid when purchasing the fund. Rather a back-end load can be imposed if the shares bought are sold within a given time. The difference between level loads and low loads in contrast to back-end loads, is that this timeframe where charges are levied is shorter.
 
No-load fund: These are associated with Class “C” Shares. As the name suggests, this fund does not charge any type of sales load. However, as noted above, not all types of shareholder fees are a “sales load.” A no-load fund can charge fees that are not sales loads, like as exchange fees, purchase fees, account fees, and redemption fees. The Class C shares will have the highest annual expense charges.


Click Here to see all Beginner Mutual Fund Articles

You may already own mutual funds, but chances are you’re making the most common mutual fund mistake: Holding on to funds regardless of whether they’re still top performers. This is where the “buy and hold” mentality of mutual funds can really shoot you in the foot.

Janet Brown, Editor of NoLoad FundX has a different approach: “Our strategy, called Upgrading, involves buying ETFs and no-load mutual funds that rank highly in our scoring system—the top performers—and holding those funds as long as they continue to outperform their peers,” she says. Janet continues: “When funds fall down in the rankings, we sell them and move on to the new current winners.”

NoLoad FundX will lead you to the top performing ETFs and funds wherever they are–domestic or international.

According to the independent Hulbert Financial Digest, NoLoad FundX has been the #2 investment newsletter over the past 25 years with an incredible 12% return—without owning a single individual stock! And it’s on the Hulbert Financial Digest 2011 Honor Roll.

How does she pick so many winners? “Don’t just invest in sectors but in managers that are getting it right,” Janet says. “Our whole strategy is to find the best funds and ETFs during their periods of outperformance.”

When a fund manager is hot, you’ll hear about it in NoLoad FundX. When a fund manager is not, Janet has no hesitation in dropping that fund like a hot potato.

Buying ETFs or mutual funds based on sporadically published “best funds” lists in Money or Kiplinger’s Personal Finance may seem smart at the time. But when the fund quietly slips, you may be totally unaware of the better funds you could be moving into.

With NoLoad FundX, you have the comfort and security of knowing:

  • The funds you own are always the top performers.
  • The funds you own are in the category that matches your tolerance for risk—and your investment objectives.
  • Every dime of your money is fully invested. There is never any load, either on the front end or on the back. You can sleep without worrying about whether Yahoo is going to tank or what quarterly profits Cisco will report because the diversification of your funds frees you from dependence on the performance of any one company.

With your subscription you get:

  • Bi-weekly issues in PDF format
  • Specific bi-weekly buy and sell recommendations
  • Bi-weekly ratings of the top 400 (every month) and 750 (mid-month) no-load mutual funds according to Janet’s proprietary Fund*X scoring method
  • Janet’s Monthly Upgrader Portfolio including her favorite international funds
  • FREE Special Reports: NEW NoLoad FundX Allocation Guide, Tools For Changing Bond Markets & NoLoad FundX Exchange Traded Funds.
  • Unlimited access to an archive of back issues


Subscribe to No-Load FundX Today!

The following strategies are used to trade ETFs.

Core/Satellite
Hedging
Leverage
Options
Shorting
Sector Rotation
Tax Loss Harvesting

Core/Satellite
This plan of action is a combination of index and active investing. Index investments, like ETFs, become the bedrock of the portfolio’s construction as well as intensely administered investments are added as satellite positions. Investors index their center holdings to more effective asset classes and restrict their choices to active managers that deliver consistent alpha or out performance for added categories. Most large pension plans today utilize a core or satellite approach in their investment policy and countless individual investors are starting to have similar approaches.

Hedging
ETFs are productive hedging tools for administering risk. Take for instance, investors will be able to guard against over concentrated equity positions by utilizing ETFs as single stock substitutes. This type of hedge technique can decrease risk and volatility by allowing stockholders to diversify elsewhere from larger equity positions to companies that own or work at. Inverse performing or short ETFs allow investors to hedge against a market decay.

Leverage
ETFs can be leveraged with margin like individual stocks. Margin is acquiring money from a broker to purchase securities, it involves considerable risk. Minimum maintenance requirements are administered by the FINRA (Financial Industry Regulatory Authority), by the NYSE and by individual brokerage firms. While margin investing can make money for investors correct, the interest charges or borrowing costs can deteriorate returns.

Options
ETF investors have an abundance of option strategies available. Purchasing call or put options can be an ambitious method. By paying a premium, an options investor will be able to control a large amount of ETF shares. The premium price is a small portion of what it would cost to buy the shares in the open market. This supports an options investor with a great amount of leverage and a high risk or reward opportunity.

A more aggressive way utilizes put options in combination with portfolio holdings. Purchasing protective puts on ETF positions will insure a portfolio against declining prices. There are other tactical possibilities with options.

Shorting
ETFs can be shorted just like individual stocks. Shorting includes selling borrowed shares an investor does not currently own by assuming the price of an ETF will lessen in financial worth. However, if the ETF does decrease in financial worth, it can be purchased by the short seller at a lower price, which results in a profit. Shorting individual stocks on a downtick isn’t acceptable. But ETFs are an exemption to this rule. This translates into easier and fluid short selling with ETFs.

Shorting is an advanced technique and involves substantial risk.

Sector Rotation
Convenient market exposure to various industry sectors is easily found with ETFs. By carefully shifting assets, investors may over and underweight distinct sectors according to their economic outlook, market objective or financial research. Possessing or exchanging concentrated business segments lets ETF investors capitalize on both the positive and negative sector trends.

Tax Loss Harvesting
Wash-sale rules wouldn’t allow investors to apprehend a stock deficiency if they repurchase the identical stock within a 30 day period. This situation can be prevented with smart tax loss planning. By transferring the loss earnings into an ETF in the identical sector as the stock, i.e., the wash-sale rule may be prevented. This will allow investors to counterbalance any capital gains with capital losses and continue to maintain market exposure.


Click Here to see all Intermediate ETF Articles


Most Active ETFs by Volume

Symbol
Name
Avg Volume
Total Assets
SPY SPDR S&P 500 122,437,320 $120,699.8 M
XLF Financial Select Sector SPDR 49,102,004 $8,232.3 M
EEM MSCI Emerging Markets Index Fund 42,278,938 $37,379.9 M
IWM Russell 2000 Index Fund 40,192,414 $17,667.3 M
QQQ QQQ 34,720,602 $34,638.4 M
VWO Emerging Markets ETF 19,842,342 $57,872.7 M
TZA Daily Small Cap Bear 3X Shares 19,332,826 $962.3 M
EFA iShares MSCI EAFE Index 18,263,959 $36,799.2 M
XLI Industrial Select Sector SPDR 13,520,156 $3,231.0 M
FXI FTSE China 25 Index Fund 13,448,381 $4,716.9 M
EWZ MSCI Brazil Index Fund 13,214,093 $8,684.2 M
GDX Market Vectors TR Gold Miners 12,772,995 $10,276.7 M
EWJ MSCI Japan Index Fund 12,379,027 $4,101.0 M
UNG United States Natural Gas Fund LP 11,814,471 $1,094.8 M
SLV Silver Trust 11,731,185 $11,148.4 M
XLE Energy Select Sector SPDR 11,183,659 $7,449.9 M
VXX S&P 500 VIX Short-Term Futures ETN 10,918,017 $6,428.9 M
XIV Daily Inverse VIX Short-Term ETN 10,558,250 $282.9 M
FAZ Daily Financial Bear 3X Shares 10,070,953 $701.1 M
TVIX Daily 2x VIX Short-Term ETN 9,500,033 $152.1 M
GLD SPDR Gold Trust 9,239,053 $76,452.4 M
TNA Daily Small Cap Bull 3X Shares 8,519,233 $648.1 M
USO United States Oil Fund 8,007,349 $1,290.6 M
XLK Technology Select Sector SPDR 7,772,023 $10,799.0 M
XLB Materials Select Sector SPDR 7,584,499 $2,369.5 M
IYR Dow Jones U.S. Real Estate Index Fund 6,483,609 $4,896.7 M
TLT Barclays 20 Year Treasury Bond Fund 6,452,129 $3,205.1 M
XLU Utilities Select Sector SPDR 6,354,533 $6,135.3 M
SSO Ultra S&P500 6,209,150 $1,569.9 M
IAU COMEX Gold Trust 6,186,352 $11,780.9 M
XLP Consumer Staples Select Sector SPDR 5,818,765 $6,225.6 M
XHB SPDR Homebuilders ETF 5,711,262 $1,954.1 M
EWT MSCI Taiwan Index Fund 5,286,026 $2,500.7 M
EWG MSCI Germany Index Fund 5,195,400 $3,605.8 M
NUGT Daily Gold Miners Bull 3x Shares 4,824,349 $388.6 M
XLV Health Care Select Sector SPDR 4,781,324 $5,391.5 M
XLY Consumer Discretionary Select Sector SPDR 4,776,647 $3,327.1 M
DIA Dow Jones Industrial Average ETF 4,558,762 $11,861.2 M
JNK SPDR Barclays Capital High Yield Bond ETF 4,497,191 $12,259.3 M
QID UltraShort QQQ 4,416,236 $450.9 M
RSX Market Vectors Russia ETF 4,249,398 $1,829.8 M
SDS UltraShort S&P500 4,242,855 $466.9 M
SPXU UltraPro Short S&P500 4,080,291 $531.7 M
FAS Daily Financial Bull 3X Shares 4,048,294 $1,199.2 M
OIH Market Vectors Oil Services ETF 3,994,468 $1,087.9 M
XOP SPDR S&P Oil & Gas Explor & Product 3,837,909 $728.5 M
XRT SPDR S&P Retail ETF 3,674,165 $778.4 M
IVV S&P 500 Index Fund 3,628,303 $33,408.1 M
EWH MSCI Hong Kong Index Fund 3,597,701 $2,499.3 M
GDXJ Market Vectors Junior Gold Miners ETF 3,408,023 $3,207.0 M
UVXY Ultra VIX Short-Term Futures ETF 3,403,966 $177.4 M
XME SPDR S&P Metals & Mining ETF 3,370,859 $972.0 M
HYG iBoxx $ High Yield Corporate Bond Fund 3,085,600 $17,148.8 M
SH Short S&P500 2,901,745 $1,936.8 M
QLD Ultra QQQ 2,826,962 $615.4 M
EPI India Earnings Fund 2,797,380 $1,101.5 M
ERY Daily Energy Bear 3X Shares 2,622,609 $113.8 M
ITB Dow Jones U.S. Home Construction Index Fund 2,477,079 $1,442.8 M
EWA MSCI Australia Index Fund 2,309,726 $2,309.7 M
DBC DB Commodity Index Tracking Fund 2,290,591 $6,147.5 M
EWS MSCI Singapore Index Fund 2,243,717 $1,591.5 M
VEA Europe Pacific 2,231,499 $9,476.9 M
VNQ REIT ETF 2,229,501 $14,555.0 M
EWW MSCI Mexico Index Fund 2,214,374 $1,344.7 M
UCO Ultra DJ-UBS Crude Oil 2,196,976 $410.5 M
MDY SPDR MidCap Trust Series I 2,104,909 $10,234.2 M
IWF Russell 1000 Growth 2,048,638 $16,873.7 M
EDZ Daily Emerging Markets Bear 3X Shares 2,039,595 $133.2 M
LQD iBoxx $ Investment Grade Corporate Bond Fund 1,990,102 $24,524.8 M
SMH Market Vectors Semiconductor ETF 1,983,599 $271.5 M
VGK European ETF 1,952,577 $3,718.0 M
UPRO UltraPro S&P 500 1,943,727 $311.9 M
AMLP Alerian MLP ETF 1,852,403 $4,269.2 M
TBT UltraShort Barclays 20+ Year Treasury 1,845,774 $780.4 M
TWM UltraShort Russell2000 1,845,241 $285.3 M
UUP DB USD Index Bullish 1,844,333 $952.7 M
KBE SPDR S&P Bank ETF 1,813,144 $1,670.3 M
EWM MSCI Malaysia Index Fund 1,748,656 $987.6 M
SQQQ UltraPro Short QQQ 1,659,036 $175.9 M
EWY MSCI South Korea Index Fund 1,639,576 $2,975.5 M
EUO UltraShort Euro 1,601,903 $719.3 M
TQQQ UltraPro QQQ 1,571,761 $225.5 M
EWC MSCI Canada Index Fund 1,564,562 $4,430.5 M
SPXS Daily S&P 500 Bear 3x Shares 1,468,552 $185.2 M
UWM Ultra Russell2000 1,444,579 $696.2 M
VTI Total Stock Market ETF 1,426,930 $23,675.0 M
AGQ Ultra Silver 1,413,627 $974.6 M
KRE SPDR S&P Regional Banking ETF 1,403,573 $1,354.2 M
IWD Russell 1000 Value 1,370,335 $13,259.9 M
DBA DB Agriculture Fund 1,370,317 $1,894.7 M
PFF S&P US Preferred Stock Fund 1,355,045 $10,287.9 M
IWN Russell 2000 Value Index Fund 1,354,450 $4,284.3 M
SCO UltraShort DJ-UBS Crude Oil 1,335,151 $106.4 M
ERX Daily Energy Bull 3X Shares 1,189,483 $265.4 M
BND Total Bond Market ETF 1,186,005 $17,452.0 M
PCY Emerging Markets Sovereign Debt Portfolio 1,165,595 $2,539.8 M


Click Here to see all Beginner ETF Articles


Definition:
A closed-end fund is a publicly traded investment company that raises a fixed amount of capital through an initial public offering (IPO). The fund is then structured, listed and traded like a stock on a stock exchange.
 
More Detail:
Despite the name similarities, a closed-end fund has little in common with a conventional mutual fund, which is technically known as an open-end fund.

The former raises a prescribed amount of capital only once through an IPO by issuing a fixed number of shares, which are purchased by investors in the closed-end fund as stock. Unlike regular stocks, closed-end fund stock represents an interest in a specialized portfolio of securities that is actively managed by an investment advisor and which typically concentrates on a specific industry, geographic market, or sector. The stock prices of a closed-end fund fluctuate according to market forces (supply and demand) as well as the changing values of the securities in the fund’s holdings.